A EUR/USD signal can fire at three in the morning and still be worth taking. A US500 signal at the same hour is a different animal: the index it points at is closed, the five hundred companies behind it are not trading, and the price your broker is quoting comes from a futures market or a synthetic book running on a fraction of its daytime participation.
That difference is exactly what most guides skip. They either explain what the S&P 500 is — large US companies, weighted by size — or they explain what a signal is, in the abstract. Almost nobody joins the two: when this specific index actually moves, what makes it move, and how those two facts should change the way you read a signal on it.
This page does the join. By the end you should be able to look at a US500 binary signal — direction, level, expiry — and judge on your own whether its timing makes sense for this index, before you commit a stake and long before you worry about which platform delivers it.
Key Takeaways
The US500 runs on the US stock market clock (9:30 a.m.-4:00 p.m. ET), not forex's 24/5 rhythm — a signal's timestamp tells you as much as its direction.
Its biggest moves come from scheduled macro events: 8:30 a.m. ET data lands before the open as a gap, while FOMC decisions move price live inside the session.
Match the contract structure to the hour: up/down suits the drifting stretches, one-touch needs the open or an event, range contracts suit the midday lull.
Align every expiry so it opens and closes inside the same regime — never straddling the bell, the open, or a scheduled release.
Table of Contents (31 min read)Contents
What a US500 Binary Signal Actually Is
US500 is the ticker most brokers use for exposure to the S&P 500 index. You will see the same thing sold as SPX500, SP500 or "US SPX 500" depending on the platform. You are never buying the index itself — an index is a calculated number, not a tradable object. You are trading a derivative quote that references it.
A binary options signal on that quote is a compact instruction with three parts: a direction, a reference level, and a deadline. The direction is a call or put — will the index be above or below the level when the clock runs out?
The level is the strike the settlement is measured against. The deadline is the expiry time, and at that instant the trade is simply in or out of the money, with nothing in between and no partial credit for having been right for four of the five minutes.
So far that is true of a signal on any asset. What makes it an index signal is the thing underneath the quote: a basket, weighted by company size, rather than a single instrument. Three consequences follow, and they are the ones that matter when you read the signal.
Single-company news gets diluted. A disappointing report from a mid-sized component barely registers in the index value. The same news on that company's own binary contract would be a violent move. Index signals therefore fire on broader conditions, not on one headline.
Macro news is amplified. When something reprices every component at once — an inflation print, a rate decision — the index moves as one body, cleanly and hard. That is the environment index signals are built for.
The largest components punch far above the rest. Because the weighting follows company size, a handful of mega-caps can drag the whole index. "Diversified" does not mean "evenly influenced". Because the S&P 500 is weighted by size, a handful of mega-caps can move the whole index — "diversified" does not mean "evenly influenced."
There is one practical wrinkle that catches new index traders. Your broker's US500 quote may be derived from the cash index or from the front-month futures contract, and those two prices are not identical — the difference between a cash index CFD and a futures index CFD shows up as a persistent offset that widens and narrows as the contract approaches expiry. A strike quoted against one feed will not line up perfectly against the other. Before you follow any US500 signal, confirm the provider and your broker are reading the same kind of quote.
If you are arriving from the wider comparison of binary options signals by asset class, hold this contrast in mind: a currency pair signal is priced off a continuous, always-open interbank market, and a single-stock signal is priced off one company's order book. An index signal sits between them, inheriting the schedule of the stock market and the shock sensitivity of the macro calendar.
When Does the US500 Move Enough to Signal?
The single biggest adjustment a forex trader has to make on this index is the clock. Forex is a rolling 24/5 market with overlapping regional sessions and no bell at either end. The S&P 500 has a bell at both ends, and it changes everything about signal timing.
The cash session runs 9:30 a.m. to 4:00 p.m. Eastern Time, Monday to Friday, with US market holidays and a handful of early closes cut out of the calendar. That six-and-a-half-hour window is when the underlying stocks actually change hands, and it is where the index's volatility genuinely lives. Index futures keep quoting almost around the clock either side of it, which is why your platform still shows a US500 price at midnight — but a price existing is not the same as a market participating.
Within the cash session the day has a recognisable shape, and each part suits a different kind of signal:
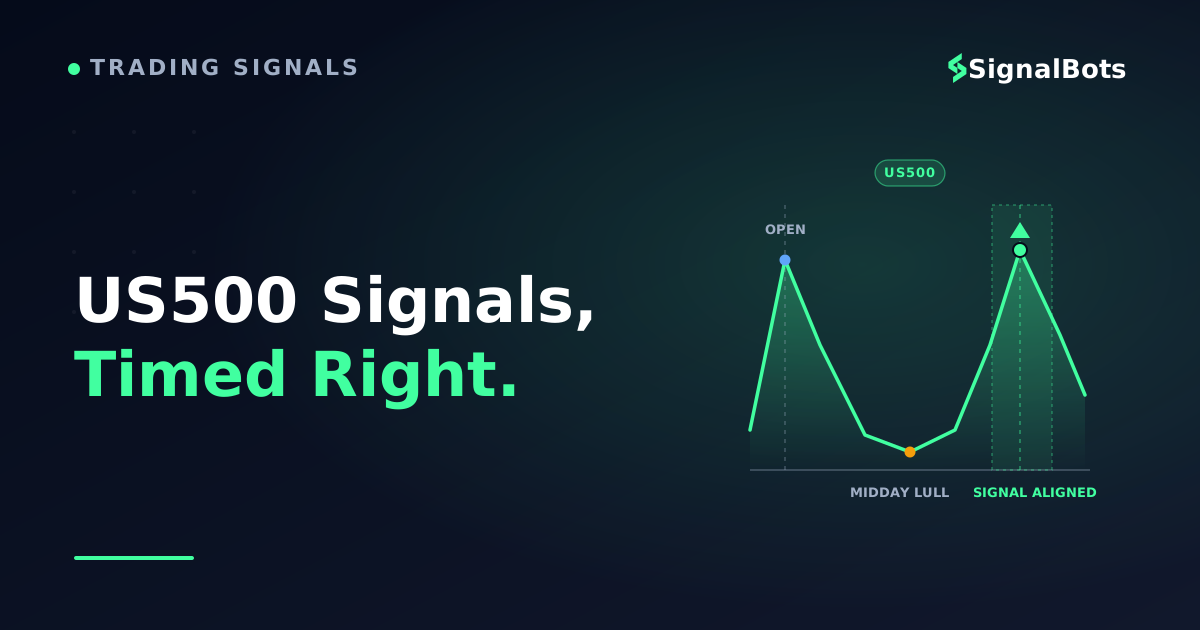
The opening stretch. The first half hour absorbs everything that accumulated overnight — foreign sessions, after-hours earnings, pre-open data. Ranges are widest and direction changes fastest. Short expiries here are exposed to the largest single-tick moves of the day.
The midday lull. Late morning into early afternoon typically compresses. Ranges narrow, moves mean-revert, and a directional signal needs a real catalyst rather than momentum to justify itself.
The closing hour. Institutional flow rebuilds into the closing auction. Moves regain size, and on the quarterly expiration Fridays they can become mechanical rather than technical — price doing what index-tracking flow requires, not what the chart suggests.
Outside those hours you are dealing with a different instrument wearing the same name. Overnight, the quote tracks index futures on thin participation, where a modest order moves price further than it would at midday and reversals are quick. On weekends and holidays many binary brokers quote a synthetic US500 on the OTC market — an internally priced book with no underlying stock market behind it at all. Signals generated for one of these regimes do not transfer to the other.
The US500's day, mapped
Overnight (Futures)
Futures trade on thin volume outside cash hours — a modest order moves price further, and reversals come quickly.
Opening Stretch
Overnight news and pre-open data land at once. Ranges run widest and direction flips fastest here.
Midday Lull
Late morning into early afternoon compresses. Moves mean-revert and need a real catalyst to hold.
Closing Hour
Institutional flow rebuilds into the close. Size returns, and expiration Fridays can turn mechanical.
After Hours & Weekends
Cash market is shut. Price tracks futures overnight, or a broker's synthetic OTC book on weekends.
The US500 is not one market all day — it is five, and a signal only belongs to one of them.
The practical habit this produces is simple: read the timestamp before you read the direction. A US500 signal is only as meaningful as the trading session it was generated in.
The Drivers a US500 Signal Is Really Tracking
A signal engine on this index is not watching five hundred companies. It is watching the handful of forces that reprice all of them at once. Knowing which one is in play tells you whether a signal is riding a catalyst or fighting one.
Scheduled US macro data. The heavyweight releases — the consumer price index and the monthly employment report — land at 8:30 a.m. ET, an hour before the cash open. That timing matters more than the numbers. The reaction happens in futures while the stock market is shut, so by the time the index opens, the move is already in the price as a price gap rather than a trend you could have entered. A signal fired into that gap is trading the aftermath, not the event.
Federal Reserve decisions. FOMC days are the exception that sits inside the session. The statement is released at 2:00 p.m. ET and the press conference follows at 2:30 p.m. ET, which produces a two-stage move with a genuine chance that the second stage reverses the first. Any expiry that spans only one of those two moments is exposed to the other.
Earnings season. Four times a year, the index's largest constituents report — and because the weighting follows size, a few of those reports move the whole index. Most US companies report after the close or before the open, so the effect reaches you as an opening gap the next morning rather than as intraday movement you can trade into.
What's an Index? The Dow, S&P 500, and Nasdaq Explained — Charles Schwab
Implied volatility. The market's own forward-looking volatility gauge, built from S&P 500 options, generally moves opposite to the index: calm markets grind up with it low, stressed markets fall with it spiking. For signal reading, treat it as a regime dial rather than a direction call. When it is elevated, the same expiry covers a much wider range of possible outcomes, so a level that looked safely distant no longer is.
Quarterly expiration and index maintenance. On the third Friday of March, June, September and December, index derivatives expire together and index rebalancing flow concentrates into the close. Volume swells, but the price behaviour is driven by mandated buying and selling rather than by opinion. Technical signals get noticeably less reliable in that window.
The through-line is that the US500 has a schedule you can see in advance. Keeping an economic calendar open beside the signal feed converts most surprises into known events, and it is what makes a deliberate news blackout window — a period around a release where you simply do not take signals — an achievable discipline rather than a good intention.
Which Contract Type Fits an Index Like the US500?
Contract choice is not a matter of preference. Each binary structure asks a different question, and the index answers some questions well at some hours and badly at others. This is the overview; each structure has its own depth elsewhere.
Up/down (high-low) asks only whether price is above or below a level at expiry. That is the most forgiving question you can ask of an index, because it does not require distance travelled — just the right side of a line. It suits the session's grinding stretches, where the index drifts rather than lunges.
One-touch asks whether price reaches a distance within a window, and it needs genuine range to be worth the payout. On the US500 that range is concentrated in the opening stretch, around scheduled releases, and into the close — which is precisely why one-touch signals on this index tend to cluster at those hours and look absurd at midday.
Range or boundary contracts pay when price stays inside a band. They are the mirror image of one-touch, and the midday compression that ruins a touch trade is exactly the condition they are built for.
The mapping principle is worth more than the list: match the contract's question to the index's volatility state at that hour, not to your preferred style. A structure that works beautifully at 10:00 a.m. ET is a poor fit at 12:30 p.m. ET on the same instrument, on the same day.
Win Rate and Reward-to-Risk, Index-Adjusted
Binary risk math is unusual in a way that trips up traders coming from spot markets. There is no stop loss to place and no winner to let run: your reward-to-risk ratio is fixed the moment you enter, set by the broker's payout percentage. Because the reward is fixed, the only lever you control is how often you are right — and how much of your capital rides on each attempt.
That produces one number worth internalising: the break-even win rate implied by your payout. A lower payout demands a higher hit rate simply to stand still, and the gap between those two figures is where every strategy either survives or bleeds out. Run your broker's actual payout through the break-even win rate calculator before you evaluate any signal source, then check what your realistic hit rate does to long-run expectancy.
Where the index changes the picture is in how those wins and losses are distributed.
Gap risk at the open is not slippage — it is discontinuity. A one-minute expiry placed around 9:30 a.m. ET can settle against a price that never traded through the levels in between. Your level was not broken; it was jumped.
Expiries that straddle the closing bell settle in a different market. A trade opened at 3:50 p.m. ET with a thirty-minute expiry resolves after the cash session has ended, on an after-hours or futures-derived print. The setup you analysed no longer exists at settlement.
Expiries that straddle a scheduled release are a coin flip on the release. Whatever edge the setup had is swamped. Aligning expiry so it opens and closes inside the same regime is the highest-value adjustment most index traders never make.
A blended win rate hides two different markets. Because overnight and cash-session behaviour are genuinely different populations, a historical win rate averaged across both tells you very little. Break the record down by session window before you trust it.
Gap risk, illustrated
US500 — the open gap over a strikeUS5001m (open)
The level was not broken, it was jumped: the open print gaps straight past the strike with no trades in between.
Suppose, illustratively, that you commit a fixed 1% stake per trade and take twenty US500 signals in a week. If twelve of them were placed in the first hour or around a release and eight in the midday lull, you do not have one twenty-trade sample — you have two small samples of very different trades, and averaging them produces a number that describes neither. Sizing consistently is what keeps those samples comparable in the first place. Binary options are high-risk, fixed-payout instruments and every trade can lose its full stake, so read our risk warning before you act on any feed.
Your Pre-Trade Checklist for a US500 Signal
Everything above collapses into a short pass you can run in well under a minute. Take a signal that reads: US500 · Put · strike 7690.1 · expiry 5 minutes · 18:15 GMT. Reading it field by field is the whole of signal anatomy applied to this index.
The symbol tells you which feed the strike belongs to — confirm your broker quotes US500 from the same kind of source, cash or futures, or the strike will sit in the wrong place. The direction is a put, so settlement wants the index below 7690.1. The strike is the only level that matters at expiry; nothing that happens in between counts. The expiry is five minutes, which means the trade must survive one specific five-minute window and nothing more. And the timestamp, 18:15 GMT, converts to roughly the middle of the New York afternoon — inside the cash session, after the FOMC-hour window on most days, and comfortably clear of the close. That signal passes the timing test. The same signal stamped 03:15 GMT would not.
Generalise that read-through into five checks and run them in the same order, every time:
Run it before every signal
US500 Signal Pre-Trade Checklist
0 / 5
Convert the signal's timestamp to Eastern Time and confirm the cash session is open.
Check the economic calendar — skip it if a scheduled release sits inside or near the expiry window.
Confirm the expiry opens and closes inside one regime, never crossing the open, the close, or a release.
Compare the strike to your own platform's live price — a large gap means a different feed or a stale signal.
Keep the stake sized the same as every other trade this week, so results stay comparable.
★
Checklist complete — you’re cleared to proceed.
Five checks, every time — tick them off before you act on any US500 signal.
The order matters, because the cheapest checks come first: two of them are answered by a clock and a calendar before you look at a price at all. A signal that fails one of those first three is not a bad signal — it is a signal whose context has changed since it was generated. A failure on the fourth check is a different warning: a strike that sits far from any price your own platform is showing usually means the provider is quoting a different reference feed, or that the setup has already been overtaken and you are looking at a stale signal. Letting either one go costs you nothing.
Reading a Live US500 Binary Signal
Once the checklist is habit, it is worth seeing the fields on a live feed rather than in a worked example. Our US500 binary signals page publishes each setup as a card carrying exactly the elements above: the direction as Call or Put, the strike, the expiry window — mostly one- and five-minute, with longer setups when the engine has more room — and a timestamp. Once the window closes, the card is marked Win, Loss or Tie and stays on the record.
That third outcome is the one worth learning from. A Tie means the settlement price matched the strike, so the stake is returned and nothing is won or lost. It belongs in neither column of a win rate, which is why a feed that quietly counts ties as wins is overstating its record. Our binary options feed leaves them out of the denominator entirely.
Timestamps on the feed are in GMT, so the session check from earlier is a small conversion: the US cash open lands at 13:30 GMT while New York is on daylight time, and 14:30 GMT once it is not. Cards stamped in the small hours of GMT are overnight futures-driven setups, and they deserve the extra scepticism this article has been arguing for. Reading a few settled cards against their timestamps is the fastest way to see the session effect in real data rather than in theory. The wider binary feed carries the same card format across other assets if you want the comparison.
It is a feed to read and act on manually, on whichever broker platform you already use. If what you actually want is US500 signals arriving inside a chart platform rather than a web page, that is a different job — our binary options MT4/MT5 connector covers that route, and it is the right starting point instead of this one.
Where to Go From Here
The short version: the US500 is a scheduled instrument. It has an open, a close, a holiday calendar and a small set of macro events that do most of the work, and a signal on it is only as good as its position within that schedule. Direction and strike tell you what the engine saw; the timestamp and the expiry tell you whether it still applies to you.
Two natural next steps. If you want the signals arriving inside a chart terminal instead of a browser tab, receiving US500 signals on MT4 is its own setup process — MetaTrader 4 needs a bridge, not just a subscription. And if you are still deciding which instrument suits your schedule at all, the full breakdown of binary options signals by asset class puts this index next to currency pairs, single stocks and crypto so you can compare their rhythms directly.
FAQ
Is US500 the same thing as the S&P 500?
Effectively yes, with one distinction that matters for signals. The S&P 500 is the index — a calculated number published by its administrator. US500 is the ticker your broker uses for a tradable derivative that references that number. The two track each other closely, but the broker quote can sit slightly above or below the published index depending on whether it is derived from the cash market or from futures, which is why a strike from one source will not align perfectly with a chart from another.
Can you trade US500 binary options at the weekend?
Many binary brokers quote a US500 price on Saturday and Sunday, but the stock market behind it is closed, so that price is a synthetic OTC quote produced by the broker rather than a reflection of live index trading. Weekend behaviour on those books tends to be quieter and less connected to real news flow. If you take weekend signals, treat them as a separate strategy with their own record, not as a continuation of your weekday results.
What expiry length suits US500 signals best?
There is no universally correct length, but there is a rule that removes most bad choices: pick the shortest expiry that lets your setup resolve without crossing a regime boundary. In the compressed midday stretch a very short expiry rarely gives price enough room to reach a level; in the opening minutes a long one leaves you exposed to several reversals. What matters more than the number is that the window opens and closes inside the same market condition.
Do US500 signals still work during earnings season?
They work, but the character of the risk changes. Because the index is weighted by company size, results from its largest constituents can move it as a whole, and most of those reports land outside trading hours. The practical effect is more overnight gapping and a less predictable open for several weeks each quarter. Signals taken well into the session are less affected than anything placed close to the bell.
How do US500 signals differ from US30 or US100 signals?
All three share the same session clock and the same macro calendar, so the timing discipline transfers directly. What differs is composition and sensitivity. A tech-heavy index reacts more sharply to a handful of large technology names and to interest-rate expectations, while a narrower thirty-component index can be swung by a single large constituent in a way the S&P 500 rarely is. The same signal logic applies; the size and speed of the typical move do not.
Why would a US500 signal be marked as a tie?
A tie means the settlement price came out exactly equal to the strike, so the contract finished neither in nor out of the money and the stake is returned. It is far more common on indices quoted to one decimal place than on currency pairs quoted to five, simply because there are fewer possible prices for the settlement to land on. A tie should never be counted as a win when you evaluate a signal record.
Sources & Further Reading
Want to go deeper? These independent, authoritative sources shaped this guide — each one is worth reading in full:
The Binary Options Desk is the SignalBots editorial team for fixed-time and OTC trading coverage. We research and write the guides that explain expiry timing, payout structure and disciplined entry across the major brokers.




Discussions 0
Leave a comment