Free US Indices Trading Signals

Live signals on the S&P 500, Nasdaq and Dow: entry, stop-loss and take-profit on every index setup, with status updating in real time. Tap any index for its full history.

Live Signals
LIVE 3 instruments Last signal 1 active now
Performance

Recent Results

Per-symbol net percentage outcome by day across the last 30 trading sessions. Filter to a symbol to isolate its track.

Monthly Summary Click to toggle
Month, Year Total (Net %) US30 US100 US500
Month-to-date 706.0 190.0 298.0 218.0
September 2026 1,376.0 476.0 506.0 394.0
August 2026 730.0 230.0 249.0 251.0
July 2026 574.0 192.0 271.0 111.0
June 2026 435.0 260.0 146.0 29.0

Disclaimer: Past performance does not guarantee future results, and the results shown here represent historical outcomes only and may not be repeated. Please trade and invest with caution; the information provided is for informational purposes only and does not constitute investment or trading advice.

US30 5 Minutes
Sell
Entry 52020.19
Stop Loss 52117.18
TP1 51923.20
TP2 51826.20
TP3 51729.21
TP4 51632.22
TP1 Hit #128065
US100 1 Minute
Sell
Entry 29251.25
Stop Loss 29268.10
TP1 29234.40
TP2 29217.55
TP3 29200.70
TP4 29183.85
TP4 Hit #128071
US500 5 Minutes
Sell
Entry 7678.63
Stop Loss 7691.03
TP1 7666.23
TP2 7653.83
TP3 7641.43
TP4 7629.04
TP3 Hit #128066
Get every signal instantly Web, Telegram, browser extension, and mobile app, all included on any plan.
FAQs

Frequently Asked Questions

How fast do signals reach me?

Every signal pushes to you in under 10 milliseconds from when our engine fires. It lands on the web dashboard, Telegram, our browser extension, and the mobile app at the same time, so you never miss an entry.

What US indices markets do you cover?

Every US indices instrument with a live track record shows up as a card on this page, busiest first. Tap any card to open its full signal history.

What's inside each signal?

A clear direction (Buy or Sell), an entry price, a protective stop loss, and take-profit targets, plus a live status that updates as the trade plays out.

How should I size each trade?

We suggest risking 1–2% of your account per trade. Your position size then follows from the stop distance on each signal and the risk percentage you're comfortable with.

Where can I see past results?

Right on this page: the Recent Results chart and the full statistics panel above show every tracked outcome. We publish the complete record, wins and losses alike.

How will I receive signals?

Through whichever channels suit you: the web dashboard, Telegram, our browser extension, and the mobile app all stay in sync, so each signal reaches you wherever you are.

How do I get VIP access?

VIP access comes with every plan; message our team and we'll set you up.

Do you guarantee profits?

No, and be wary of anyone who does. US Indices trading carries substantial risk. Read our Risk Warning and judge the historical edge for yourself before subscribing.

Can I cancel any time?

Yes. Cancel in one click from your dashboard, no hidden fees and no auto-renewal traps.

Still have questions?

Our team is happy to help before you join; get in touch and we'll walk you through anything you're unsure about.

Index coverage

S&P 500, Nasdaq 100 and Dow Jones Signals, Each on Its Own Terms

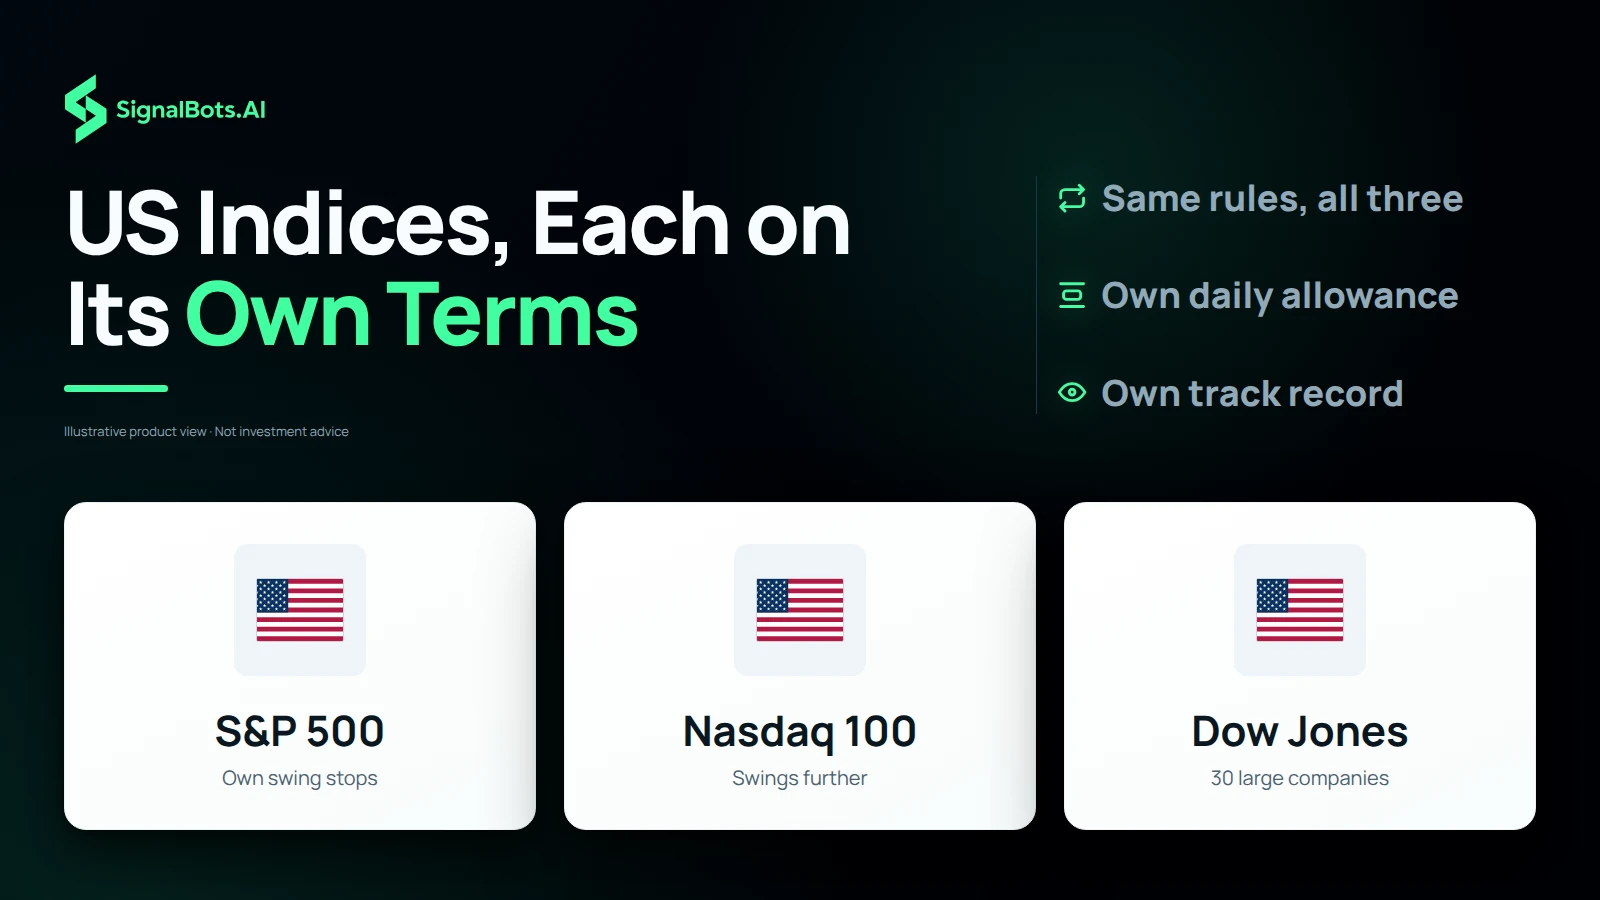
The Nasdaq 100 leans heavily on technology and usually swings further than the S&P 500, while the Dow Jones tracks just 30 large US companies. US500, US100 and US30 are therefore read separately: each index gets a stop-loss drawn from its own recent swings, its own daily signal allowance and its own track record. The rules are identical across all three, so when you compare a Nasdaq setup with an S&P 500 setup, you are comparing the markets, not two different methods.

Three white tiles for the S&P 500, Nasdaq 100 and Dow Jones, each with a small US flag and a short note (own swing stops, swings further, 30 large companies), under the headline 'US Indices, Each on Its Own Terms' with labels for same rules on all three, own daily allowance and own track record; an illustrative product view.
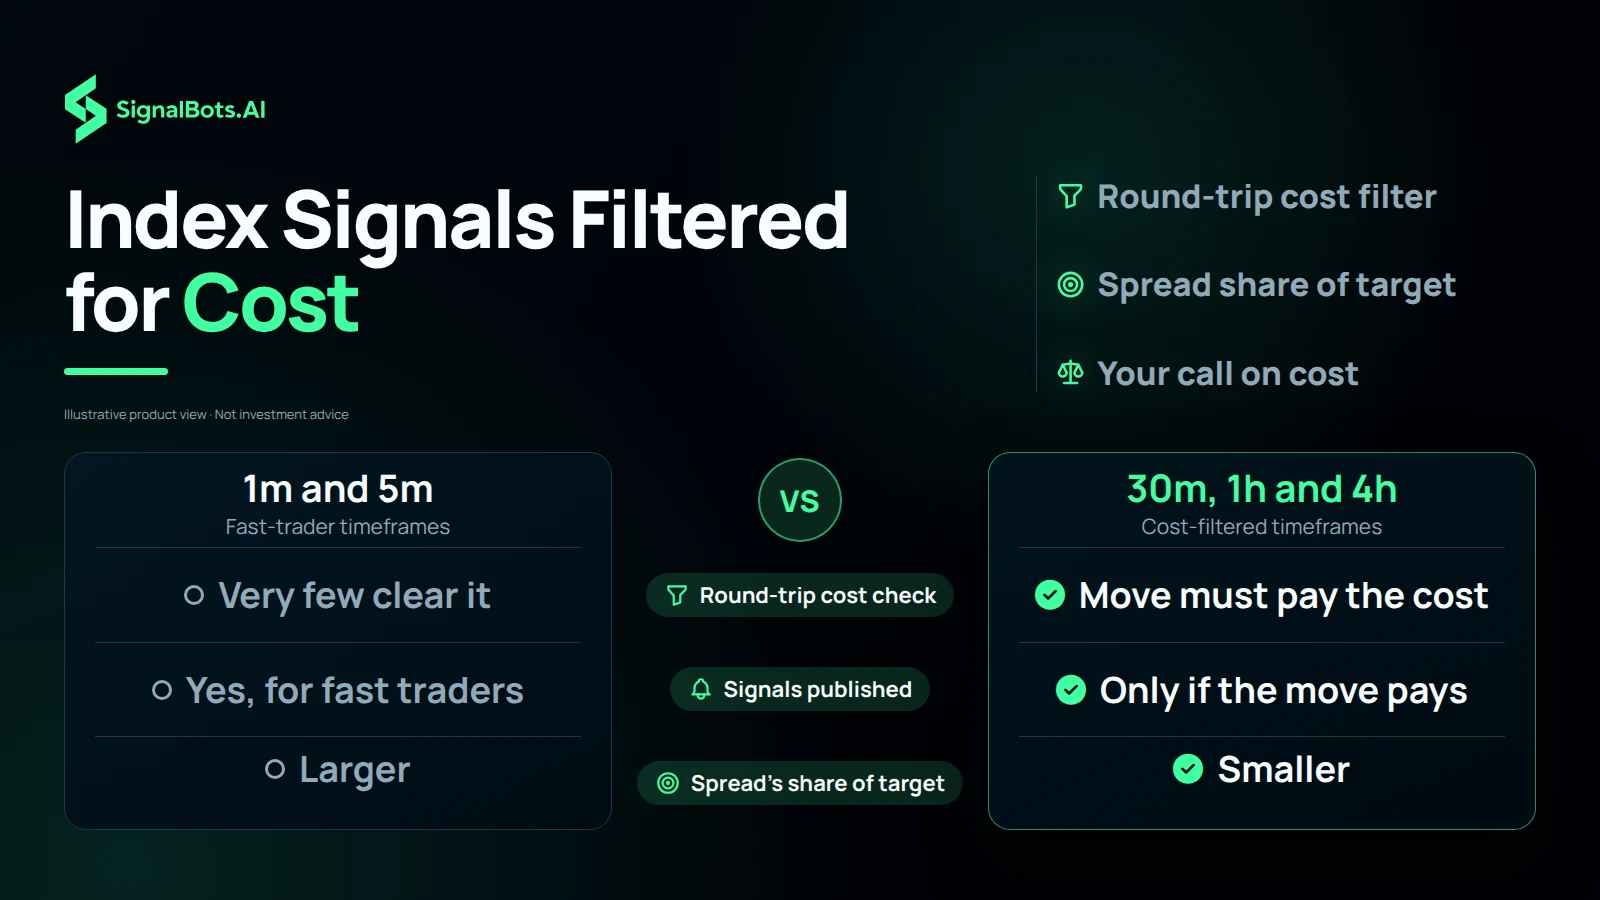
Two-column comparison of 1m and 5m charts against 30m, 1h and 4h charts. On 30m, 1h and 4h a signal is published only if the move pays the round-trip cost, and the spread takes a smaller share of the target. On 1m and 5m very few setups clear the cost check, signals still go out for fast traders, and the spread's share is larger. Illustrative product view.

Trading cost

Index Trading Signals Filtered for Spread and Trading Cost

An index setup that looks clean on the chart can still lose much of its value to the spread. On 30m, 1h and 4h charts, a setup is published only when the index is moving enough on that timeframe to be worth the round-trip cost of trading it. On 1m and 5m, where very few setups would clear that bar, signals are still published for fast traders, but the spread takes a larger share of each target, so the timeframe you choose is also a decision about cost.

Signal timing

US30 and NAS100 Signals at the Candle Close

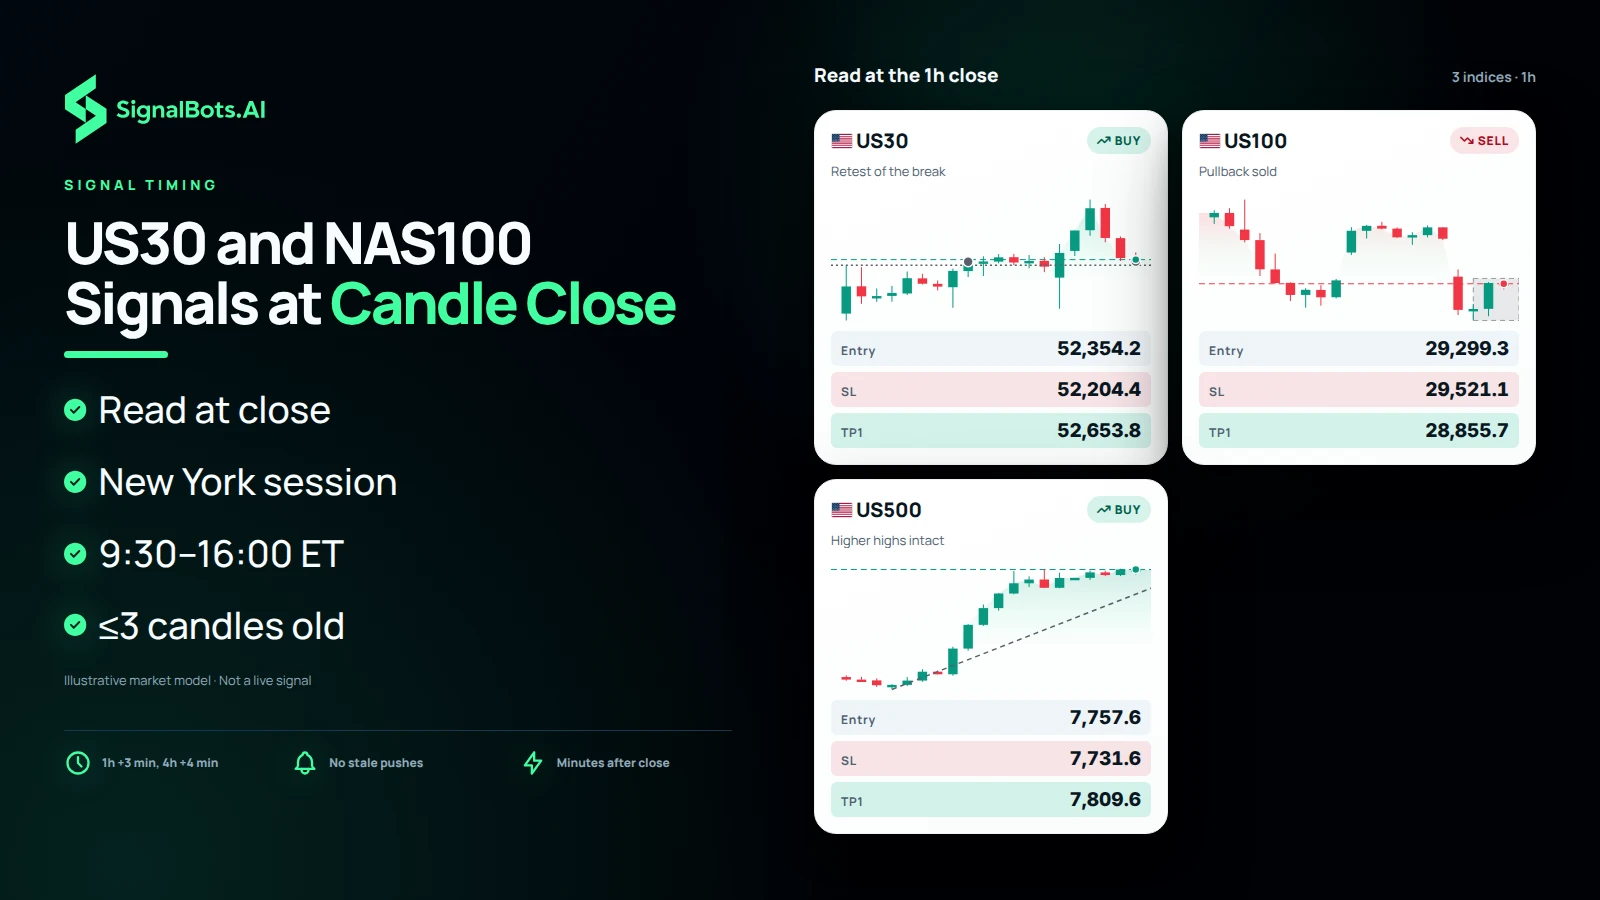
A signal that arrives after the move is a different trade from the one that was planned. S&P 500, Nasdaq 100 and Dow Jones setups are read on the candle that has just closed (the 1h chart three minutes past the hour, the 4h chart four minutes after its close), and new ones are issued only during the New York cash session, 9:30 to 16:00 Eastern Time. A setup more than three candles old is never pushed to Telegram, so you are not handed an entry the market has already left behind.

Illustrative 1h signal board titled 'Read at the 1h close' with three US index cards, each strip ending on its just-closed setup candle. US30 is a buy on a retest of the break, US100 a sell on a pullback, and US500 a buy with higher highs intact. Each card shows a modelled entry, stop-loss and first target. Beside the board are notes on reading at the close, the New York session from 9:30 to 16:00 ET, and a limit of three candles old.
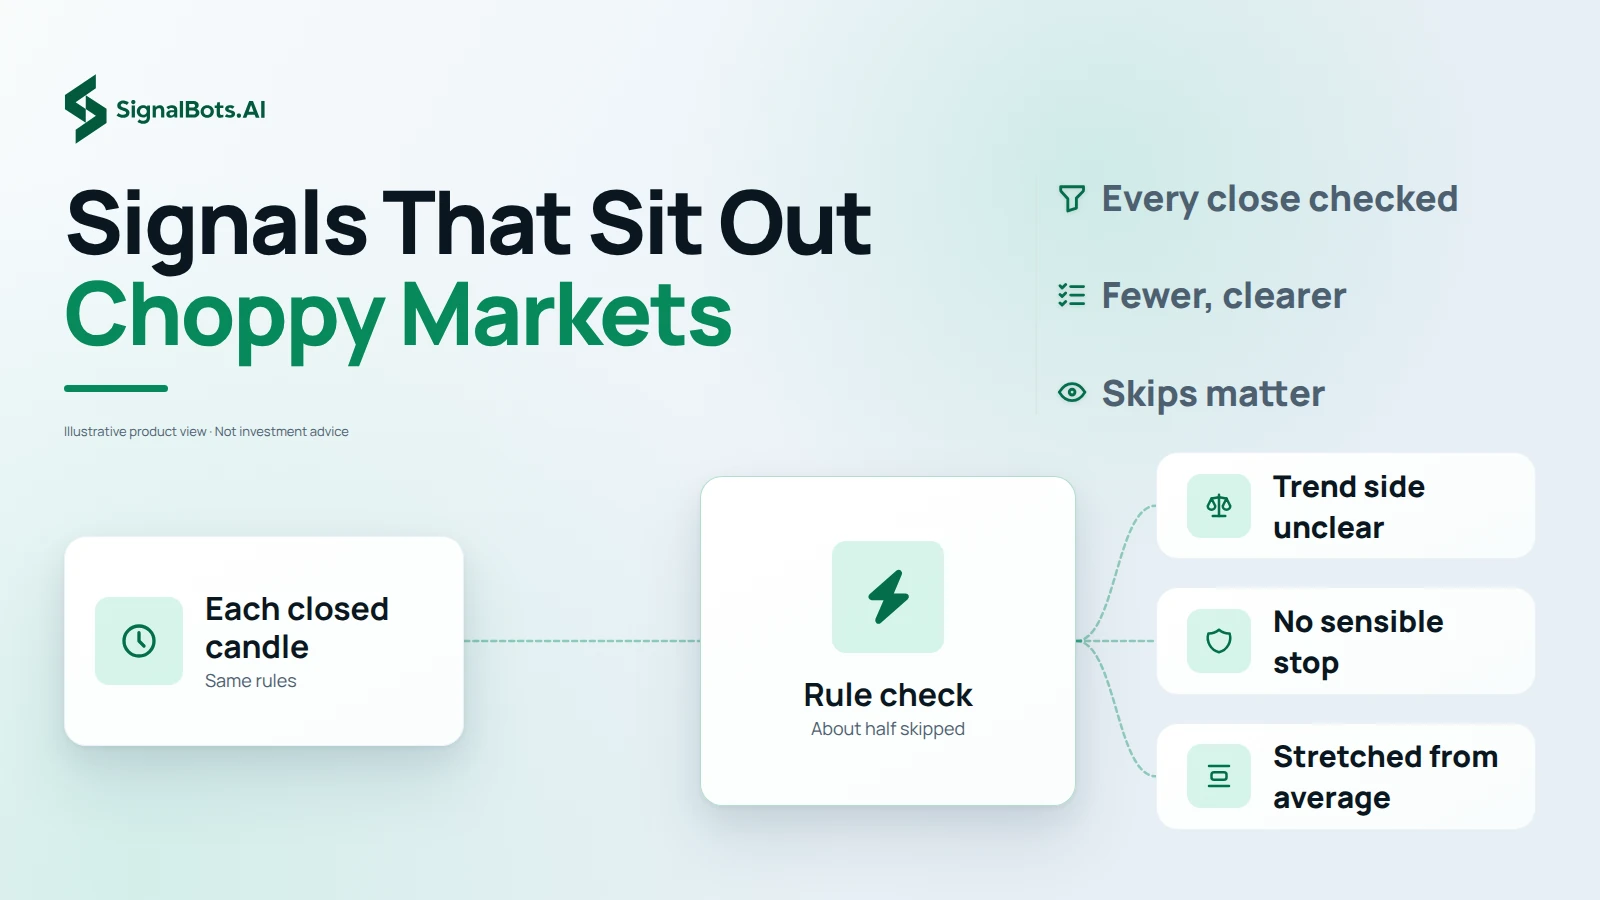
Flow diagram in which each closed candle goes through one rule check, with about half skipped, then branches to the three reasons no signal is published: trend side unclear, no sensible stop, and price stretched from its average. Labels read every close checked, fewer clearer setups and skips matter. Illustrative product view.

Selective signals

US Index Day Trading Signals That Sit Out Choppy Markets

The middle of the US session can chop back and forth for hours, and every false start is a chance to overtrade. Each closed candle is checked against the same rules, and roughly half of them produce no signal at all, because the trend side is unclear, no sensible stop fits, or price is already stretched from its average. For a day trader, those skipped candles matter as much as the published ones: fewer, clearer setups mean less time spent reacting to noise.

Position sizing

Position Sizing for S&P 500 and Nasdaq Signals

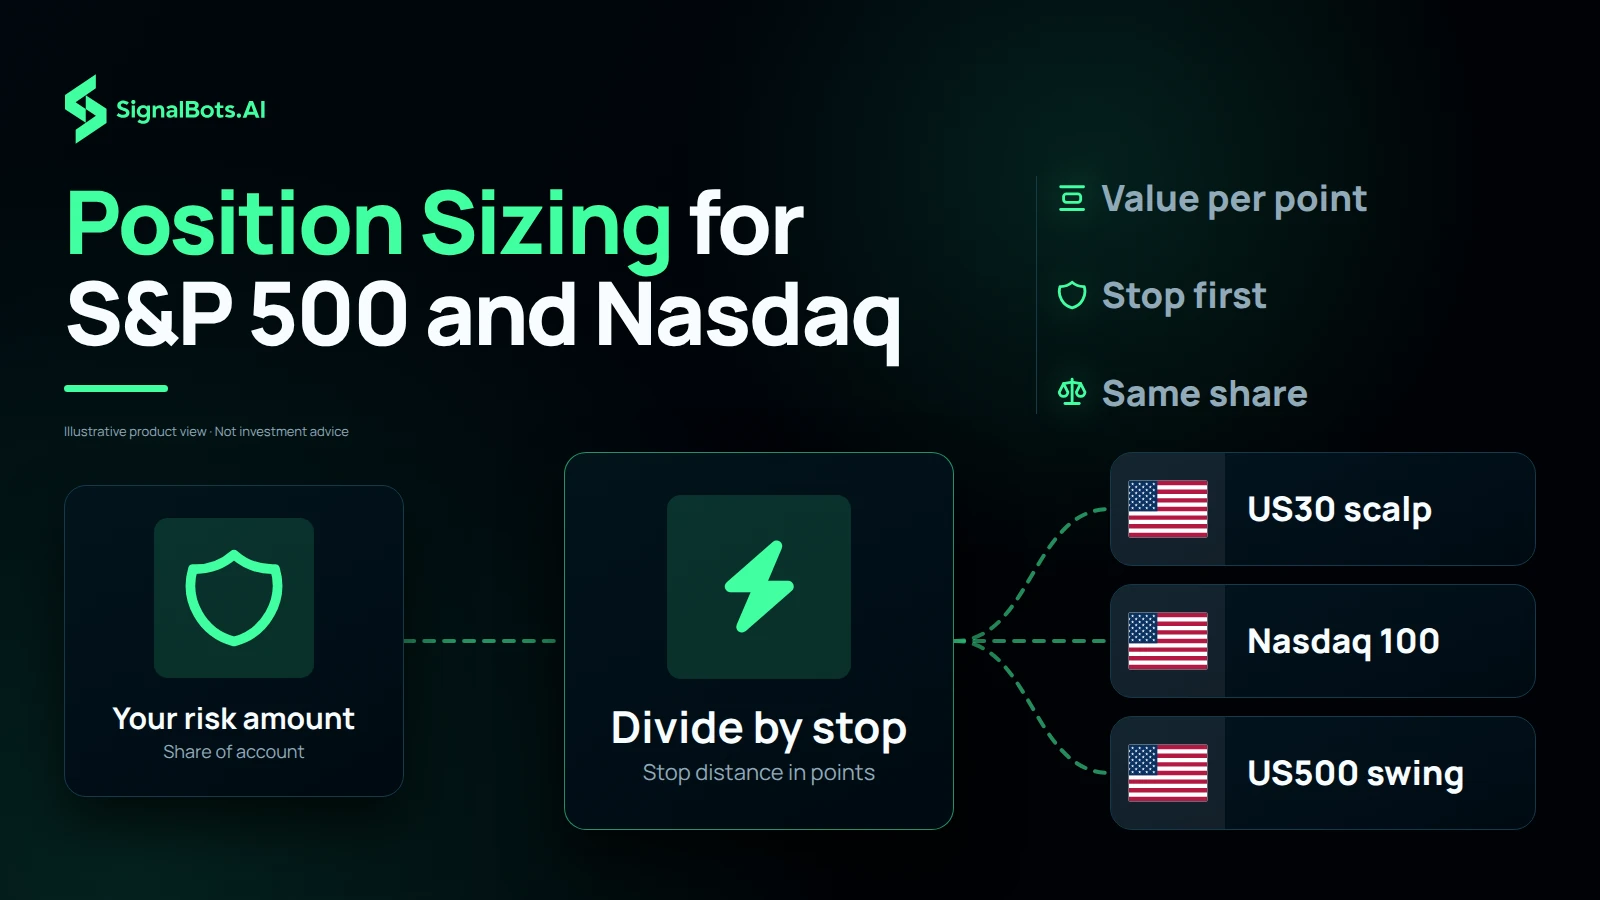
Index CFDs are quoted in points, and what one point is worth depends on the contract size your broker uses. Because every signal states its stop-loss before you enter, sizing is simple arithmetic: decide how much of your account you are prepared to risk, divide it by the stop distance in points, then adjust for your broker's value per point. Each trade then risks the same share of your account, whether it is a tight US30 scalp or a wider US500 swing.

Flow diagram that starts at your risk amount (a share of the account), divides by the stop distance in points, and ends at three index tiles with US flags labelled US30 scalp, Nasdaq 100 and US500 swing. Labels read value per point, stop first and same share. Illustrative product view, with no account size, point value or lot figures.

Win Rate

Wins vs losses
76%
Win Rate

Gain Chart

Cumulative growth over the last 120 days
Past performance is not indicative of future results. US Indices trading carries substantial risk. Review our Risk Warning before subscribing.
ROI Calculator

What if you traded with us?

Move the slider: see the cumulative return our tracked signals produced over the last 7 days, applied to your starting capital.

Starting $1,000
After last 7 days $1,760 +$760
Hypothetical, based on historical Win Rate. Not a guarantee of future returns.
+3681.47%
Total Gain
10.17%
Max Drawdown
+$330705.9
Net Profit
Full Advanced Statistics Click to expand

Advanced Statistics

Updated Oct 19, 2026 · 06:36 GMT
Balance $340705.9
Equity (100.00%) $340705.9
Floating PL $0.0
Deposits $10000.0
Withdrawals $0
Trades 1465
Pips 330705900
Won 95%
Avg. Trade Time
Lots 190.45
Profit Factor 9.83
Daily 6.24%
Monthly 187.19%
Trades Per Month 83
Expectancy 3695553.8 Pips / $3695.55
Built for your broker

Keep your broker. Keep your edge.

No switching accounts, no relearning a platform. Whichever forex broker you already trade with, these signals plug straight in. Read them here, or let our extensions, robots and connectors act on them for you.

Trusted by traders

What US Indices Traders Are Saying

A US Indices trade plan I can check before acting

On the US Indices signals page, the US Indices entry, stop and targets give me a defined checklist instead of a rushed decision.

Alice Johansson
Alice Johansson Sweden

US Indices history makes the process easier to review

I use the US Indices Recent Results and US Indices monthly table to study the setup before I decide whether it fits my own risk plan.

Yiannis Nikolaidis
Yiannis Nikolaidis Greece

US Indices levels help me avoid chasing

Seeing the US Indices US Indices stop alongside the target keeps me patient when price is already moving quickly.

Mia Muller
Mia Muller Germany

US Indices context without hiding the risk

The US Indices US Indices page makes the outcome history visible, so I can keep position size and risk limits under my own control.

Jakub Svoboda
Jakub Svoboda Czechia

One focused view for US Indices

The US Indices US Indices alerts and symbol filters make it much easier to follow the instruments I actually trade.

Jennifer Johnson
Jennifer Johnson United States

Ready to trade US indices with us?

Full access to every signal across 3 instruments, with instant alerts on the web, Telegram, our extension and mobile app.

No card needed