Gold & Silver Signals

Gold (XAU/USD) Trading Signals

Real-time Gold (XAU/USD) signals with a full trade plan: entry, stop-loss, and take-profit targets, delivered in under 10ms on the web, Telegram, our browser extension and mobile app.

Live Signals
LIVE Last Gold (XAU/USD) signal 2 active now
Performance

Recent Results: Gold & Silver

Per-symbol net pip outcome by day across the last 30 trading sessions. Filter to a symbol to isolate its track.

Monthly Summary: Gold & Silver Click to toggle
Month, Year Total (Pips) XAU/USD
Month-to-date 10,965.0 10,965.0
September 2026 10,005.0 10,005.0
August 2026 3,945.0 3,945.0
July 2026 1,650.0 1,650.0
June 2026 3,315.0 3,315.0

Disclaimer: Past performance does not guarantee future results, and the results shown here represent historical outcomes only and may not be repeated. Please trade and invest with caution; the information provided is for informational purposes only and does not constitute investment or trading advice.

Direction
Get every Gold (XAU/USD) signal instantly Web, Telegram, browser extension, and mobile app, all included on any plan.
XAU/USD 30 Minutes
Sell
Entry 4026.14
Stop Loss 4048.28
TP1 4004.00
TP2 3981.86
TP3 3959.73
TP4 3937.59
VIP Clients Only
Active #130302
XAU/USD 1 Minute
Sell
Entry 4024.25
Stop Loss 4031.02
TP1 4017.48
TP2 4010.71
TP3 4003.93
TP4 3997.16
Loss #130301
XAU/USD 5 Minutes
Sell
Entry 4032.76
Stop Loss 4036.75
TP1 4028.77
TP2 4024.78
TP3 4020.79
TP4 4016.81
TP4 Hit #130292
XAU/USD 4 Hours
Sell
Entry 4038.16
Stop Loss 4087.07
TP1 3989.25
TP2 3940.33
TP3 3891.42
TP4 3842.50
VIP Clients Only
Active #130287
XAU/USD 1 Minute
Sell
Entry 4038.99
Stop Loss 4040.07
TP1 4037.91
TP2 4036.84
TP3 4035.76
TP4 4034.68
TP2 Hit #130259
XAU/USD 1 Hour
Sell
Entry 4051.94
Stop Loss 4085.26
TP1 4018.62
TP2 3985.30
TP3 3951.98
TP4 3918.66
TP1 Hit #130184
XAU/USD 1 Minute
Sell
Entry 4041.91
Stop Loss 4043.07
TP1 4040.75
TP2 4039.60
TP3 4038.44
TP4 4037.29
TP4 Hit #130119
XAU/USD 5 Minutes
Buy
Entry 4048.96
Stop Loss 4044.03
TP1 4053.89
TP2 4058.82
TP3 4063.76
TP4 4068.69
TP2 Hit #130093
XAU/USD 4 Hours
Sell
Entry 4052.97
Stop Loss 4079.23
TP1 4026.71
TP2 4000.44
TP3 3974.18
TP4 3947.91
TP1 Hit #130090
Trade Ledger

Last 20 Signals: Gold & Silver

Date, time Order Price Take Profit Stop Loss State Entry Exit Profit
October 29, 2026 at 9:30 AM GMT Oct 29, 26 09:30 GMT Sell 4026.14 4004.00, 3981.86, 3959.73, 3937.59 4048.28 Active - - -
October 29, 2026 at 9:00 AM GMT Oct 29, 26 09:00 GMT Sell 4024.25 4017.48, 4010.71, 4003.93, 3997.16 4031.02 Loss 4024.25 4031.02 -67700
October 29, 2026 at 8:05 AM GMT Oct 29, 26 08:05 GMT Sell 4032.76 4028.77, 4024.78, 4020.79, 4016.81 4036.75 TP4 Hit 4032.76 4016.81 +159500
October 29, 2026 at 5:00 AM GMT Oct 29, 26 05:00 GMT Sell 4038.16 3989.25, 3940.33, 3891.42, 3842.50 4087.07 Active - - -
October 29, 2026 at 4:10 AM GMT Oct 29, 26 04:10 GMT Sell 4038.99 4037.91, 4036.84, 4035.76, 4034.68 4040.07 TP2 Hit 4038.99 4036.84 +21500
October 28, 2026 at 11:00 PM GMT Oct 28, 26 23:00 GMT Sell 4051.94 4018.62, 3985.30, 3951.98, 3918.66 4085.26 TP1 Hit 4051.94 4018.62 +333200
October 28, 2026 at 4:00 PM GMT Oct 28, 26 16:00 GMT Sell 4041.91 4040.75, 4039.60, 4038.44, 4037.29 4043.07 TP4 Hit 4041.91 4037.29 +46200
October 28, 2026 at 12:10 PM GMT Oct 28, 26 12:10 GMT Buy 4048.96 4053.89, 4058.82, 4063.76, 4068.69 4044.03 TP2 Hit 4048.96 4058.82 +98600
October 28, 2026 at 9:00 AM GMT Oct 28, 26 09:00 GMT Sell 4052.97 4026.71, 4000.44, 3974.18, 3947.91 4079.23 TP1 Hit 4052.97 4026.71 +262600
October 28, 2026 at 8:35 AM GMT Oct 28, 26 08:35 GMT Buy 4049.43 4050.79, 4052.14, 4053.50, 4054.85 4048.07 TP4 Hit 4049.43 4054.85 +54200
October 28, 2026 at 2:00 AM GMT Oct 28, 26 02:00 GMT Sell 4048.93 4045.93, 4042.93, 4039.94, 4036.94 4051.93 TP4 Hit 4048.93 4036.94 +119900
October 27, 2026 at 4:10 PM GMT Oct 27, 26 16:10 GMT Buy 4058.38 4062.69, 4067.01, 4071.32, 4075.64 4054.07 TP2 Hit 4058.38 4067.01 +86300
October 27, 2026 at 1:00 PM GMT Oct 27, 26 13:00 GMT Sell 4023.20 3996.52, 3969.84, 3943.16, 3916.47 4049.88 Loss 4023.20 4049.88 -266800
October 27, 2026 at 12:15 PM GMT Oct 27, 26 12:15 GMT Buy 4013.24 4014.67, 4016.10, 4017.54, 4018.97 4011.81 TP4 Hit 4013.24 4018.97 +57300
October 27, 2026 at 12:15 PM GMT Oct 27, 26 12:15 GMT Buy 4013.24 4018.56, 4023.89, 4029.21, 4034.54 4007.92 TP4 Hit 4013.24 4034.54 +213000
October 27, 2026 at 8:05 AM GMT Oct 27, 26 08:05 GMT Sell 3999.80 3996.79, 3993.79, 3990.78, 3987.78 4002.81 TP3 Hit 3999.80 3990.78 +90200
October 27, 2026 at 7:30 AM GMT Oct 27, 26 07:30 GMT Sell 4004.03 3999.55, 3995.08, 3990.60, 3986.13 4008.51 TP3 Hit 4004.03 3990.60 +134300
October 27, 2026 at 6:00 AM GMT Oct 27, 26 06:00 GMT Sell 4008.99 3990.43, 3971.88, 3953.32, 3934.77 4027.55 TP1 Hit 4008.99 3990.43 +185600
October 27, 2026 at 1:45 AM GMT Oct 27, 26 01:45 GMT Buy 4016.51 4018.84, 4021.18, 4023.51, 4025.84 4014.18 Loss 4016.51 4014.18 -23300
October 26, 2026 at 5:00 PM GMT Oct 26, 26 17:00 GMT Sell 4020.95 3993.05, 3965.16, 3937.26, 3909.37 4048.85 TP1 Hit 4020.95 3993.05 +279000
Binary Options

XAU/USD Binary Signals

The binary options record for XAU/USD: strike, direction and expiry on every call, settled Win, Loss or Tie.

Performance

Recent Results: Binary Options

Wins and losses by day across the last 30 trading sessions. Filter to a symbol to isolate its track.

Monthly Summary: Binary Options Click to toggle
Month, Year Total (Payout pts) XAU/USD
Month-to-date 2,815 2,815
September 2026 3,640 3,640
August 2026 -100 -100
July 2026 0 -
June 2026 0 -

Binary Options Signal Cards

XAU/USD 1 Minute
Call
Strike 4054.41
Expiry 1 Minute
Strategy SB Rules v1
Win #130192
XAU/USD 1 Minute
Put
Strike 4041.91
Expiry 1 Minute
Strategy SB Rules v1
Win #130120
XAU/USD 4 Hours
Put
Strike 4036.71
Expiry 4 Hours
Strategy SB Rules v1
Loss #130055
XAU/USD 5 Minutes
Call
Strike 4060.33
Expiry 5 Minutes
Strategy SB Rules v1
Win #129960
XAU/USD 30 Minutes
Put
Strike 4013.32
Expiry 30 Minutes
Strategy SB Rules v1
Win #129720
XAU/USD 1 Minute
Put
Strike 3997.57
Expiry 1 Minute
Strategy SB Rules v1
Win #129542
Trade Ledger

Last 20 Signals: Binary Options

Date, time Direction Strike Expiry State Result Payout
October 29, 2026 at 12:00 AM GMT Oct 29, 26 00:00 GMT Long 4054.41 1 Minute Settled Win +85
October 28, 2026 at 4:00 PM GMT Oct 28, 26 16:00 GMT Short 4041.91 1 Minute Settled Win +85
October 28, 2026 at 5:00 AM GMT Oct 28, 26 05:00 GMT Short 4036.71 4 Hours Settled Loss -100
October 27, 2026 at 9:00 PM GMT Oct 27, 26 21:00 GMT Long 4060.33 5 Minutes Settled Win +85
October 26, 2026 at 8:00 PM GMT Oct 26, 26 20:00 GMT Short 4013.32 30 Minutes Settled Win +85
October 26, 2026 at 12:00 AM GMT Oct 26, 26 00:00 GMT Short 3997.57 5 Minutes Settled Win +85
October 26, 2026 at 12:00 AM GMT Oct 26, 26 00:00 GMT Short 3997.57 1 Minute Settled Win +85
October 25, 2026 at 10:10 PM GMT Oct 25, 26 22:10 GMT Short 3996.52 1 Minute Settled Win +85
October 23, 2026 at 9:00 PM GMT Oct 23, 26 21:00 GMT Short 3995.81 30 Minutes Settled Loss -100
October 23, 2026 at 12:00 PM GMT Oct 23, 26 12:00 GMT Long 4024.6 1 Minute Settled Win +85
October 23, 2026 at 12:00 AM GMT Oct 23, 26 00:00 GMT Short 4023.82 1 Minute Settled Win +85
October 22, 2026 at 4:00 PM GMT Oct 22, 26 16:00 GMT Short 4051.95 1 Minute Settled Win +85
October 22, 2026 at 12:00 AM GMT Oct 22, 26 00:00 GMT Short 4125.5 1 Minute Settled Win +85
October 19, 2026 at 10:20 PM GMT Oct 19, 26 22:20 GMT Short 4141.14 1 Minute Settled Win +85
October 19, 2026 at 8:05 AM GMT Oct 19, 26 08:05 GMT Short 4178.2 1 Minute Settled Win +85
October 19, 2026 at 8:00 AM GMT Oct 19, 26 08:00 GMT Long 4173.0 30 Minutes Settled Win +85
October 18, 2026 at 10:05 PM GMT Oct 18, 26 22:05 GMT Long 4167.24 1 Minute Settled Win +85
October 16, 2026 at 9:00 PM GMT Oct 16, 26 21:00 GMT Long 4165.42 30 Minutes Settled Win +85
October 16, 2026 at 9:00 PM GMT Oct 16, 26 21:00 GMT Long 4165.42 1 Hour Settled Win +85
October 16, 2026 at 8:50 PM GMT Oct 16, 26 20:50 GMT Short 4167.02 5 Minutes Settled Win +85
Futures

Gold (GC JUN26) Futures Signals

The futures record for Gold (GC JUN26): the same instrument traded on the exchange contract, with its own entry, stop and targets.

Performance

Recent Results: Futures

Per-symbol net percentage outcome by day across the last 30 trading sessions. Filter to a symbol to isolate its track.

Monthly Summary: Futures Click to toggle
Month, Year Total (Net %) GC JUN26
Month-to-date 92.0 92.0
September 2026 75.0 75.0
August 2026 197.0 197.0
July 2026 90.0 90.0
June 2026 105.0 105.0

Futures Signal Cards

GC JUN26 4 Hours
Sell
Entry 4062.80
Stop Loss 4089.68
TP1 4035.92
TP2 4009.05
TP3 3982.17
TP4 3955.29
Loss #130135
GC JUN26 1 Hour
Sell
Entry 4030.60
Stop Loss 4045.73
TP1 4015.47
TP2 4000.35
TP3 3985.22
TP4 3970.09
TP1 Hit #129699
GC JUN26 1 Hour
Sell
Entry 4151.30
Stop Loss 4166.47
TP1 4136.13
TP2 4120.96
TP3 4105.78
TP4 4090.61
TP4 Hit #128957
GC JUN26 1 Hour
Sell
Entry 4158.20
Stop Loss 4177.14
TP1 4139.26
TP2 4120.33
TP3 4101.39
TP4 4082.45
TP4 Hit #128681
GC JUN26 4 Hours
Sell
Entry 4160.30
Stop Loss 4224.49
TP1 4096.11
TP2 4031.91
TP3 3967.72
TP4 3903.53
TP2 Hit #128552
GC JUN26 4 Hours
Sell
Entry 4194.60
Stop Loss 4224.90
TP1 4164.30
TP2 4134.01
TP3 4103.71
TP4 4073.42
TP4 Hit #128349
Trade Ledger

Last 20 Signals: Futures

Date, time Order Price Take Profit Stop Loss State Entry Exit Profit
October 28, 2026 at 2:00 PM GMT Oct 28, 26 14:00 GMT Sell 4062.80 4035.92, 4009.05, 3982.17, 3955.29 4089.68 Loss 4062.80 4089.68 -268800
October 26, 2026 at 4:00 PM GMT Oct 26, 26 16:00 GMT Sell 4030.60 4015.47, 4000.35, 3985.22, 3970.09 4045.73 TP1 Hit 4030.60 4015.47 +151300
October 21, 2026 at 8:00 PM GMT Oct 21, 26 20:00 GMT Sell 4151.30 4136.13, 4120.96, 4105.78, 4090.61 4166.47 TP4 Hit 4151.30 4090.61 +606900
October 20, 2026 at 3:00 PM GMT Oct 20, 26 15:00 GMT Sell 4158.20 4139.26, 4120.33, 4101.39, 4082.45 4177.14 TP4 Hit 4158.20 4082.45 +757500
October 19, 2026 at 10:00 PM GMT Oct 19, 26 22:00 GMT Sell 4160.30 4096.11, 4031.91, 3967.72, 3903.53 4224.49 TP2 Hit 4160.30 4031.91 +1283900
October 19, 2026 at 2:00 AM GMT Oct 19, 26 02:00 GMT Sell 4194.60 4164.30, 4134.01, 4103.71, 4073.42 4224.90 TP4 Hit 4194.60 4073.42 +1211800
October 16, 2026 at 10:00 PM GMT Oct 16, 26 22:00 GMT Sell 4186.70 4148.53, 4110.37, 4072.20, 4034.03 4224.87 TP4 Hit 4186.70 4034.03 +1526700
October 16, 2026 at 9:00 PM GMT Oct 16, 26 21:00 GMT Buy 4186.70 4201.20, 4215.70, 4230.20, 4244.70 4172.20 TP1 Hit 4186.70 4201.20 +145000
October 15, 2026 at 10:00 AM GMT Oct 15, 26 10:00 GMT Sell 4178.60 4148.44, 4118.29, 4088.13, 4057.97 4208.76 Loss 4178.60 4208.76 -301600
October 14, 2026 at 4:00 AM GMT Oct 14, 26 04:00 GMT Sell 4185.90 4174.60, 4163.31, 4152.01, 4140.72 4197.20 TP4 Hit 4185.90 4140.72 +451800
October 12, 2026 at 10:00 PM GMT Oct 12, 26 22:00 GMT Sell 4195.90 4145.54, 4095.18, 4044.81, 3994.45 4246.26 TP4 Hit 4195.90 3994.45 +2014500
October 12, 2026 at 9:00 PM GMT Oct 12, 26 21:00 GMT Sell 4195.90 4185.46, 4175.02, 4164.58, 4154.14 4206.34 TP2 Hit 4195.90 4175.02 +208800
October 11, 2026 at 11:00 PM GMT Oct 11, 26 23:00 GMT Buy 4210.60 4229.84, 4249.08, 4268.32, 4287.56 4191.36 TP1 Hit 4210.60 4229.84 +192400
October 8, 2026 at 10:00 AM GMT Oct 8, 26 10:00 GMT Sell 4147.80 4078.58, 4009.35, 3940.13, 3870.91 4217.02 Loss 4147.80 4217.02 -692200
October 6, 2026 at 6:00 PM GMT Oct 6, 26 18:00 GMT Sell 4192.00 4158.39, 4124.77, 4091.16, 4057.55 4225.61 TP2 Hit 4192.00 4124.77 +672300
October 5, 2026 at 9:00 PM GMT Oct 5, 26 21:00 GMT Sell 4167.60 4135.88, 4104.16, 4072.44, 4040.71 4199.32 TP1 Hit 4167.60 4135.88 +317200
October 2, 2026 at 2:00 PM GMT Oct 2, 26 14:00 GMT Sell 4216.10 4170.15, 4124.21, 4078.26, 4032.32 4262.05 TP2 Hit 4216.10 4124.21 +918900
October 2, 2026 at 6:00 AM GMT Oct 2, 26 06:00 GMT Sell 4216.00 4181.60, 4147.21, 4112.81, 4078.41 4250.40 Loss 4216.00 4250.40 -344000
September 30, 2026 at 2:00 PM GMT Sep 30, 26 14:00 GMT Sell 4208.60 4161.28, 4113.95, 4066.63, 4019.30 4255.92 Loss 4208.60 4255.92 -473200
September 25, 2026 at 10:00 PM GMT Sep 25, 26 22:00 GMT Sell 4320.50 4284.40, 4248.30, 4212.20, 4176.10 4356.60 TP4 Hit 4320.50 4176.10 +1444000
FAQs

Common questions about Gold (XAU/USD) signals

How fast do signals reach me?

Every signal pushes to you in under 10 milliseconds from when our engine fires. It lands on the web dashboard, Telegram, our browser extension, and the mobile app at the same time, so you never miss an entry.

What gold & silver markets do you cover?

Every gold & silver instrument with a live track record shows up as a card on this page, busiest first. Tap any card to open its full signal history.

What's inside each signal?

A clear direction (Buy or Sell), an entry price, a protective stop loss, and take-profit targets, plus a live status that updates as the trade plays out.

How should I size each trade?

We suggest risking 1–2% of your account per trade. Your position size then follows from the stop distance on each signal and the risk percentage you're comfortable with.

Where can I see past results?

Right on this page: the Recent Results chart and the full statistics panel above show every tracked outcome. We publish the complete record, wins and losses alike.

How will I receive signals?

Through whichever channels suit you: the web dashboard, Telegram, our browser extension, and the mobile app all stay in sync, so each signal reaches you wherever you are.

How do I get VIP access?

VIP access comes with every plan; message our team and we'll set you up.

Do you guarantee profits?

No, and be wary of anyone who does. Gold & Silver trading carries substantial risk. Read our Risk Warning and judge the historical edge for yourself before subscribing.

Can I cancel any time?

Yes. Cancel in one click from your dashboard, no hidden fees and no auto-renewal traps.

Still have questions?

Our team is happy to help before you join; get in touch and we'll walk you through anything you're unsure about.

What drives gold

XAUUSD Forex Signals and What Moves Gold

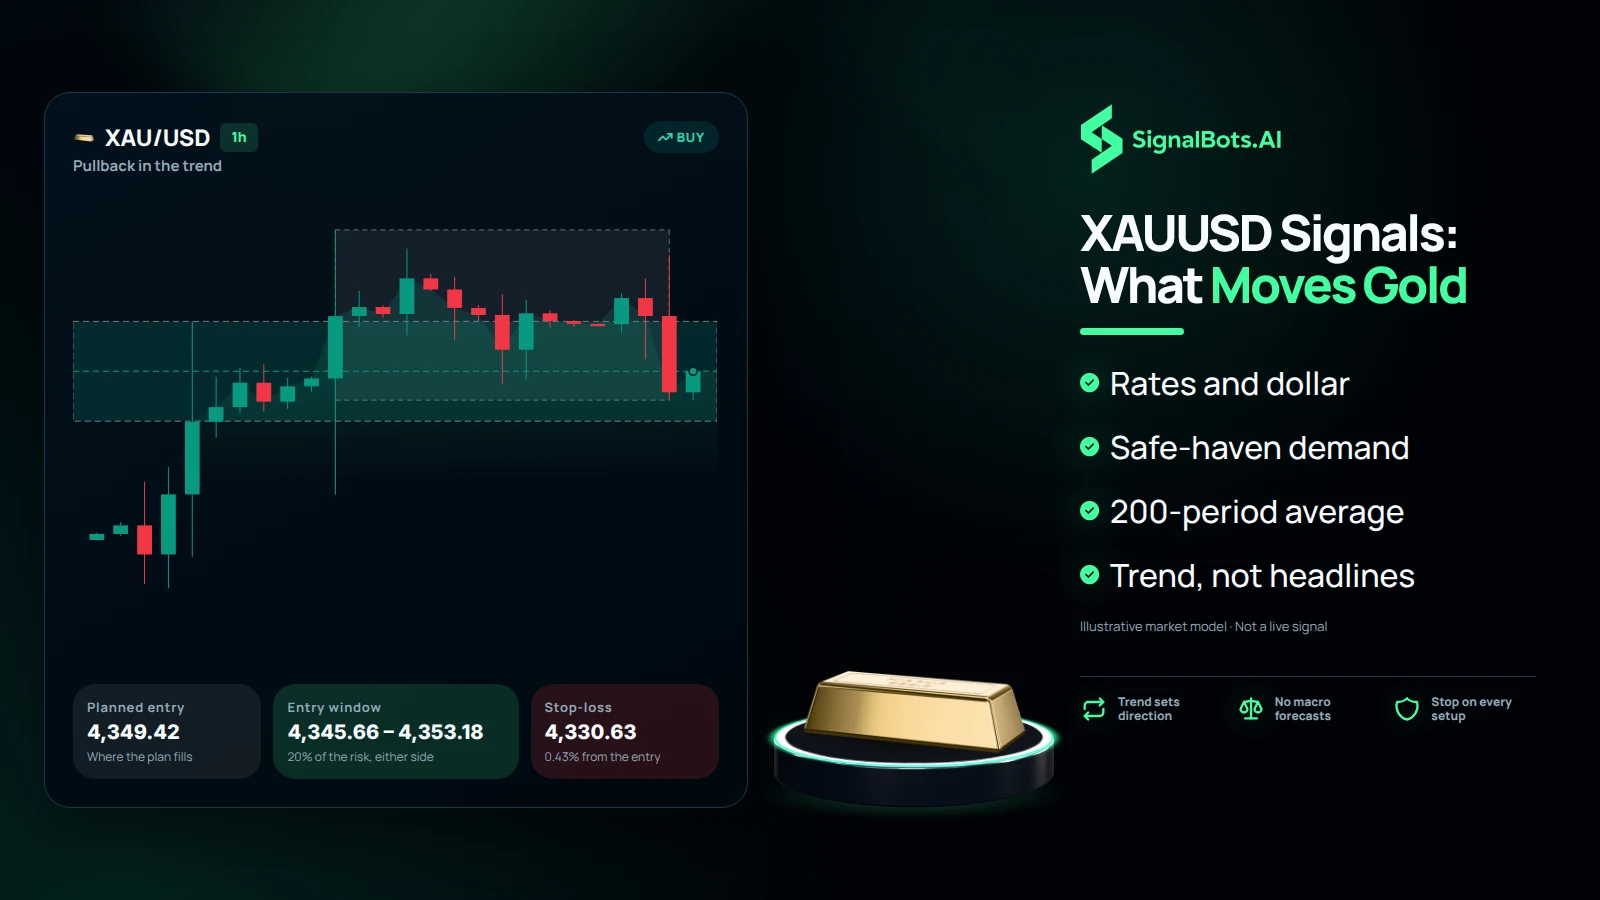
Gold pays no interest, so it tends to rise when real interest rates fall and when the US dollar weakens, and it draws safe-haven demand when markets are under stress. Central-bank buying has added a steady source of demand in recent years. Each XAU/USD signal follows the trend those forces leave on the chart, reading direction from price against the 200-period average instead of predicting the next macro headline.

Dark illustration headed "XAUUSD Signals: What Moves Gold": a 1h XAU/USD buy chart titled "Pullback in the trend" with planned entry, entry window and stop-loss cards, a gold bar on a lit podium, and bullets for rates and dollar, safe-haven demand, the 200-period average and trend over headlines.
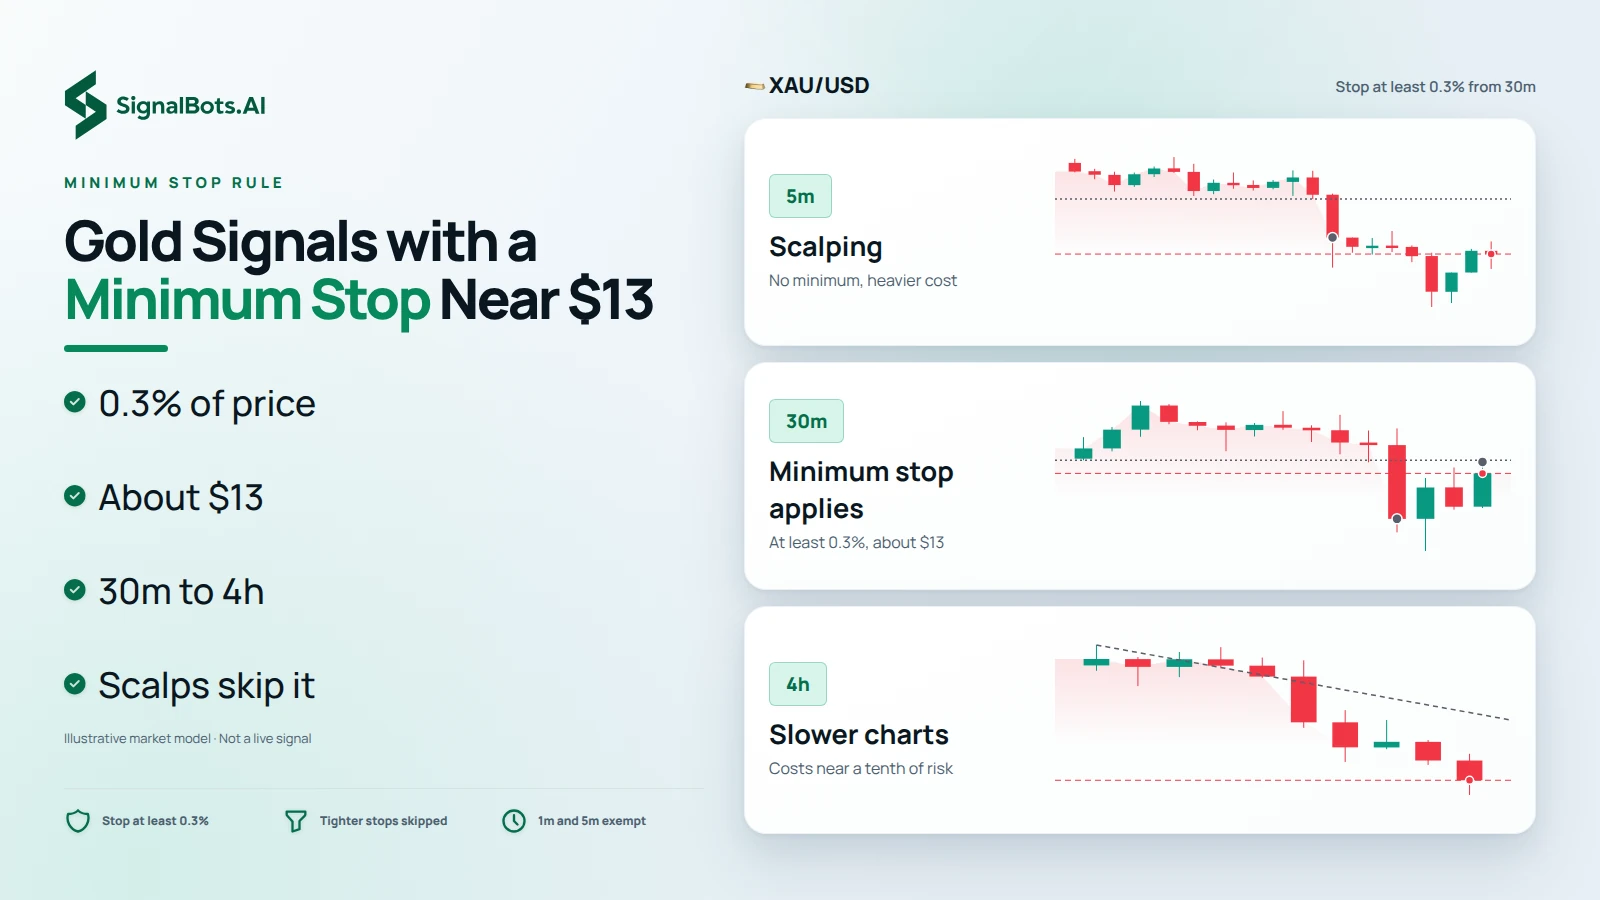
Light illustration headed "Gold Signals with a Minimum Stop Near $13": XAU/USD charted at 5m, 30m and 4h as three rungs labelled Scalping (no minimum, heavier cost), Minimum stop applies (at least 0.3%, about $13) and Slower charts (costs near a tenth of risk).

Minimum stop rule

Gold Trading Signals with a Minimum Stop of About $13

Gold costs more to trade than a major currency pair, so on 30m, 1h and 4h charts an XAU/USD setup is published only when its stop is at least 0.3% of the price from entry, about $13 an ounce at current levels. That keeps costs near a tenth of the risk. Intraday gold stops usually land well beyond that minimum, while 1m and 5m scalping setups skip it and carry a heavier cost per target.

Size from the stop

Position Sizing for XAU/USD Signals

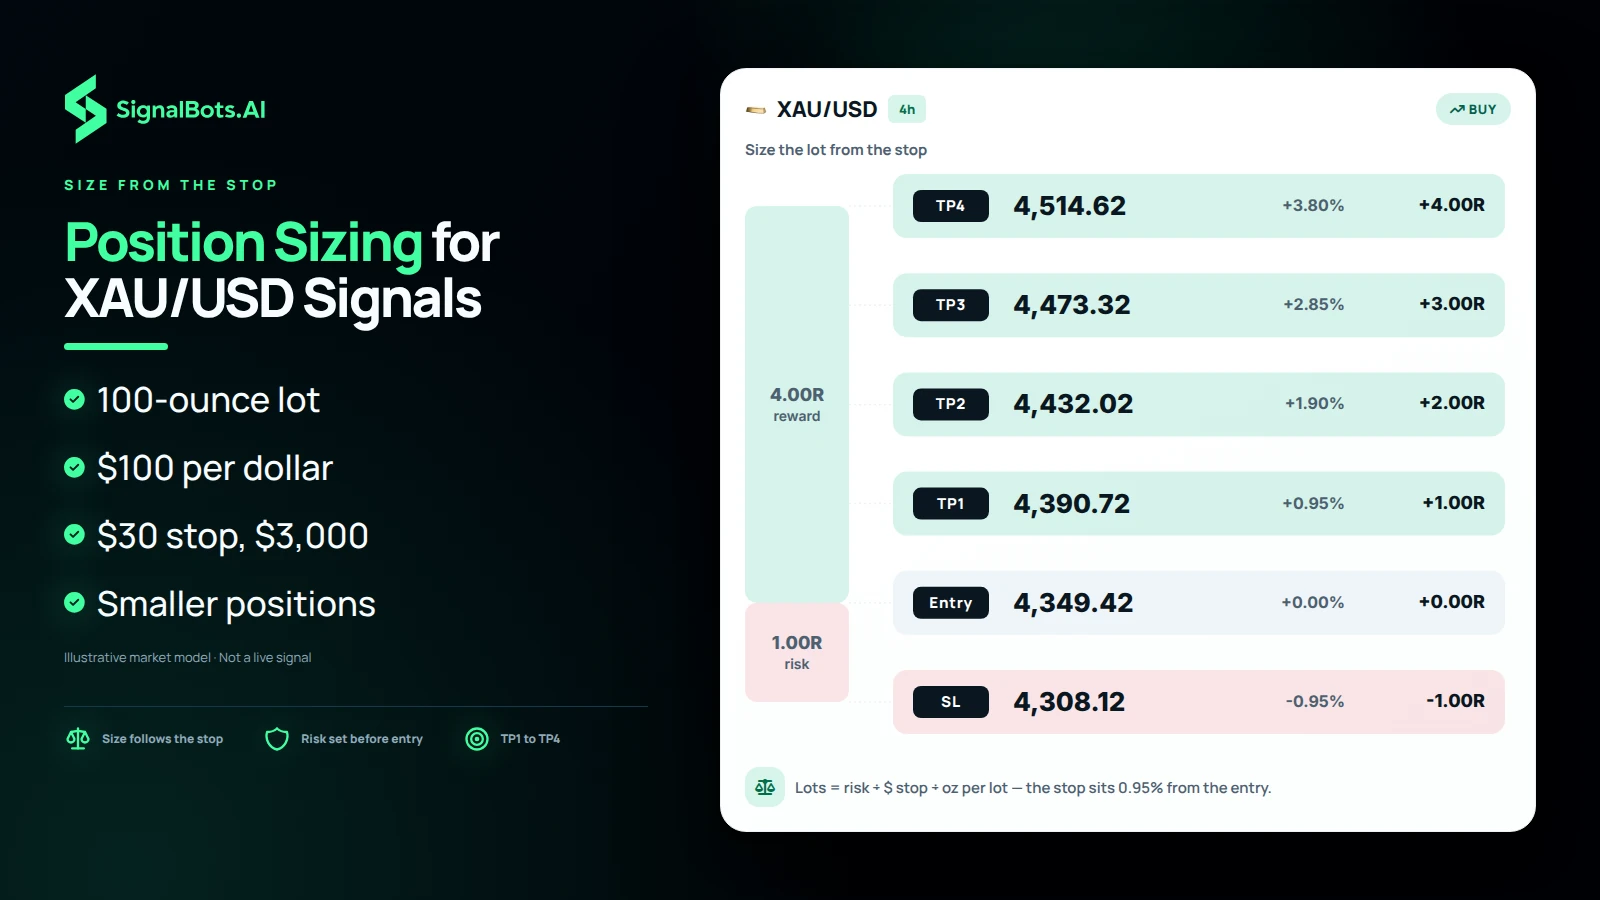
A standard lot of gold is usually 100 ounces, so each dollar of price movement is worth about $100 per lot, and a $30 stop means $3,000 at risk on a single lot. Size each XAU/USD signal from its stop: divide the amount you are prepared to risk by the stop in dollars, then by your broker's contract size in ounces. Gold's wide stops then translate into smaller positions, not larger losses.

Duotone illustration headed "Position Sizing for XAU/USD Signals": a 4h XAU/USD buy plan drawn to scale with stop-loss, entry and take-profits TP1 to TP4 at 1R to 4R, a note that lots equal risk divided by the dollar stop and ounces per lot, and bullets on the 100-ounce lot.
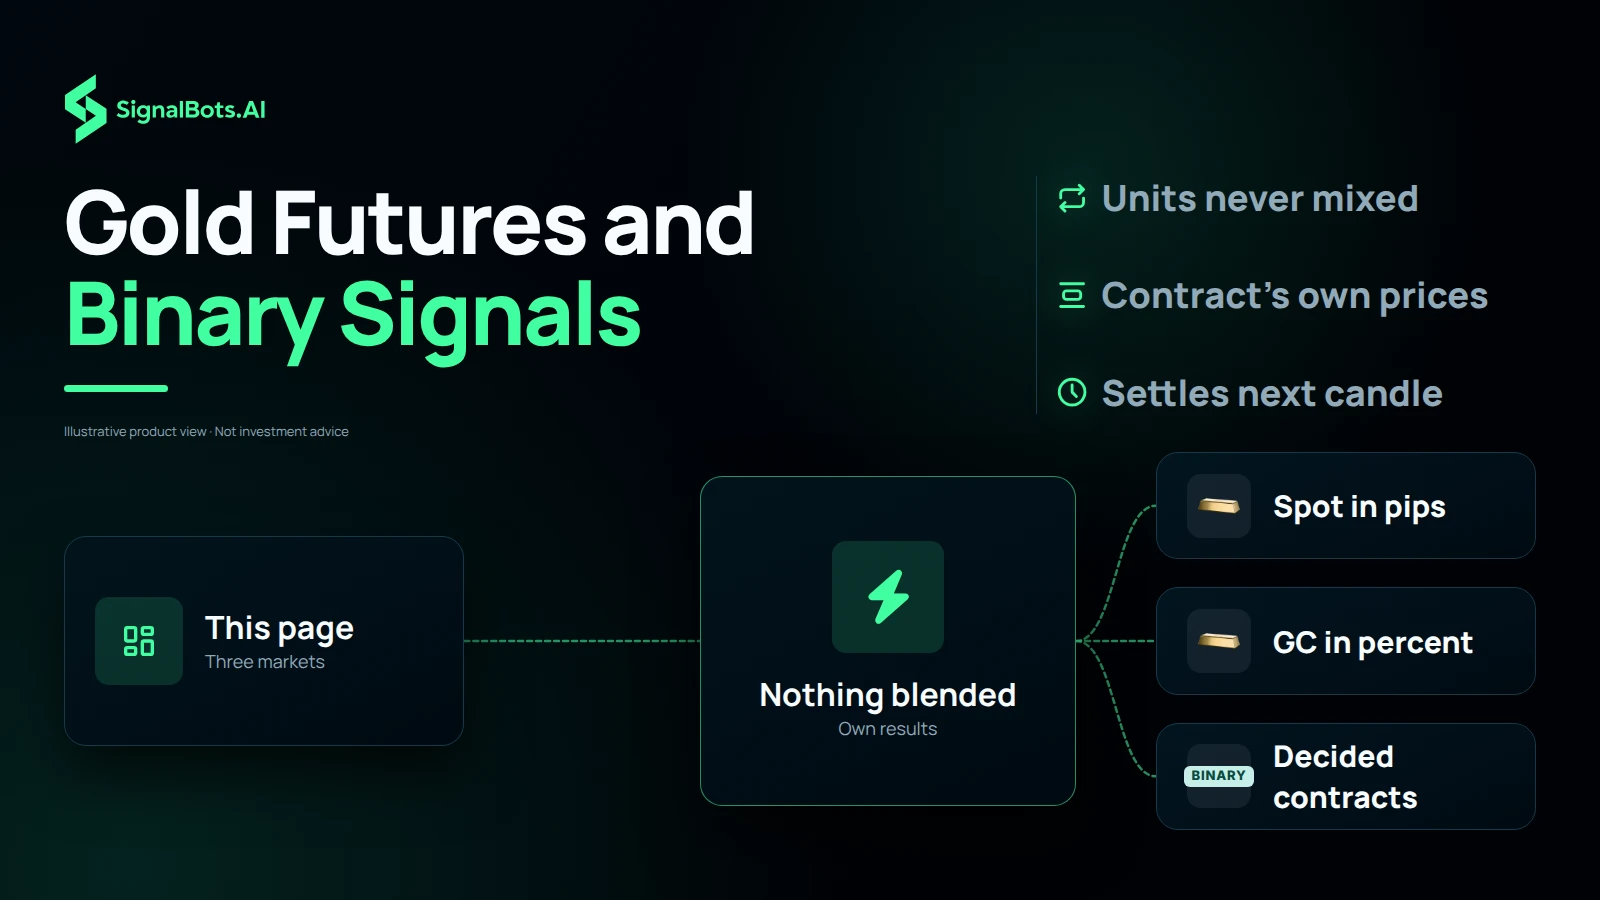
Dark flow diagram headed "Gold Futures and Binary Signals": a This page card for three markets feeds a Nothing blended hub that splits into spot in pips, GC futures in percent and binary decided contracts, beside notes that units are never mixed and binaries settle next candle.

Separate gold markets

Gold Futures (GC) and XAU/USD Binary Signals

Two more gold markets are signalled on this page. COMEX gold futures, contract GC, are read from the contract's own prices, which usually sit above spot because they build in financing costs, so their levels match what a futures trader actually sees. XAU/USD binary options signals share the spot direction rule and settle one candle after their entry close. Each market has its own results section and its own unit of measure.

How trades are scored

XAU/USD Signal Results and the 180-Candle Rule

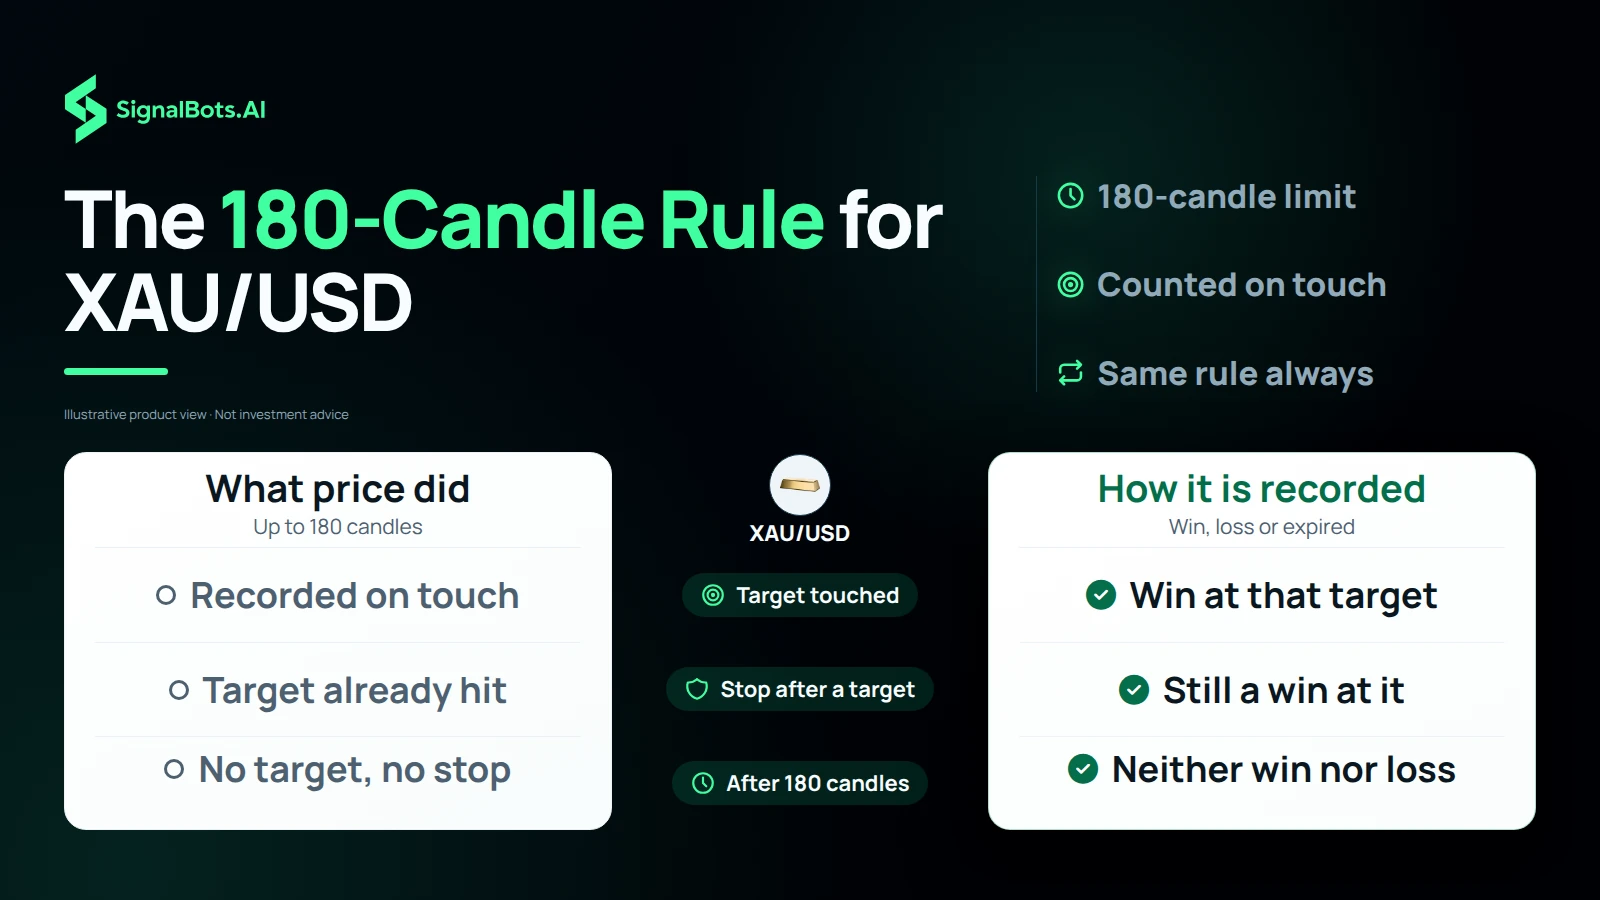
Gold can stall for days between moves, so the way a slow trade is closed matters. Each XAU/USD signal is followed for up to 180 candles; if it reaches no target and no stop in that time, it is closed as expired and counted as neither a win nor a loss. Targets are recorded as soon as they are touched, and a stop that follows a target leaves the trade on the books as a win at that target.

Duotone comparison table headed "The 180-Candle Rule for XAU/USD" sets what price did beside how it is recorded: a touched target is a win, a stop after a target is still a win, and 180 candles with no target or stop is neither win nor loss.

Win Rate

Wins vs losses
82%
Win Rate

Gain Chart

Cumulative growth over the last 120 days
Past performance is not indicative of future results. Gold & Silver trading carries substantial risk. Review our Risk Warning before subscribing.
ROI Calculator

What if you traded with us?

Move the slider: see the cumulative return our tracked signals produced over the last 7 days, applied to your starting capital.

Starting $1,000
After last 7 days $1,760 +$760
Hypothetical, based on historical Win Rate. Not a guarantee of future returns.
+42771.2%
Total Gain
1.17%
Max Drawdown
+$4227190.0
Net Profit
Full Advanced Statistics Click to expand

Advanced Statistics

Updated Oct 29, 2026 · 11:11 GMT
Balance $4237190.0
Equity (100.00%) $4237190.0
Floating PL $0.0
Deposits $10000.0
Withdrawals $0
Trades 534
Pips 42271900
Won 100%
Avg. Trade Time
Lots 69.42
Profit Factor 85.66
Daily 224.85%
Monthly 6745.52%
Trades Per Month 85
Expectancy 1425706.7 Pips / $142570.67
Trusted by traders

What Gold (XAU/USD) Traders Are Saying

A Gold (XAU/USD) trade plan I can check before acting

On the Gold & Silver signals page, the Gold (XAU/USD) entry, stop and targets give me a defined checklist instead of a rushed decision.

Noah Keller
Noah Keller Switzerland

Gold (XAU/USD) history makes the process easier to review

I use the Gold & Silver Recent Results and Gold (XAU/USD) monthly table to study the setup before I decide whether it fits my own risk plan.

Maximilian Wagner
Maximilian Wagner Austria

Gold (XAU/USD) levels help me avoid chasing

Seeing the Gold & Silver Gold (XAU/USD) stop alongside the target keeps me patient when price is already moving quickly.

Sofia Ferrari
Sofia Ferrari Italy

Gold (XAU/USD) context without hiding the risk

The Gold & Silver Gold (XAU/USD) page makes the outcome history visible, so I can keep position size and risk limits under my own control.

Jakob Larsen
Jakob Larsen Norway

One focused view for Gold (XAU/USD)

The Gold & Silver Gold (XAU/USD) alerts and symbol filters make it much easier to follow the instruments I actually trade.

Mariam Al Kaabi
Mariam Al Kaabi Qatar

Ready to trade Gold (XAU/USD) with us?

Full access to every signal, with instant alerts on the web, Telegram, our extension and mobile app.

No card needed
VIP Access $49/mo · 7-day free trial