US Indices Signals

Dow Jones 30 (US30) Trading Signals

Real-time Dow Jones 30 (US30) signals with a full trade plan: entry, stop-loss, and take-profit targets, delivered in under 10ms on the web, Telegram, our browser extension and mobile app.

Live Signals
LIVE Last Dow Jones 30 (US30) signal 7 active now
Performance

Recent Results: US Indices

Per-symbol net percentage outcome by day across the last 30 trading sessions. Filter to a symbol to isolate its track.

Monthly Summary: US Indices Click to toggle
Month, Year Total (Net %) US30
Month-to-date 437.0 437.0
September 2026 476.0 476.0
August 2026 230.0 230.0
July 2026 192.0 192.0
June 2026 260.0 260.0

Disclaimer: Past performance does not guarantee future results, and the results shown here represent historical outcomes only and may not be repeated. Please trade and invest with caution; the information provided is for informational purposes only and does not constitute investment or trading advice.

Direction
Get every Dow Jones 30 (US30) signal instantly Web, Telegram, browser extension, and mobile app, all included on any plan.
US30 30 Minutes
Buy
Entry 52454.23
Stop Loss 52336.99
TP1 52571.47
TP2 52688.72
TP3 52805.96
TP4 52923.21
VIP Clients Only
Active #130157
US30 1 Hour
Buy
Entry 52459.24
Stop Loss 52214.49
TP1 52703.99
TP2 52948.75
TP3 53193.50
TP4 53438.25
VIP Clients Only
Active #130113
US30 1 Minute
Buy
Entry 52434.23
Stop Loss 52355.11
TP1 52513.35
TP2 52592.46
TP3 52671.58
TP4 52750.70
TP1 Hit #130107
US30 4 Hours
Buy
Entry 52392.23
Stop Loss 52013.45
TP1 52771.01
TP2 53149.80
TP3 53528.58
TP4 53907.36
VIP Clients Only
Active #130136
US30 5 Minutes
Sell
Entry 52387.23
Stop Loss 52415.21
TP1 52359.25
TP2 52331.28
TP3 52303.30
TP4 52275.33
TP1 Hit #129929
US30 1 Hour
Buy
Entry 52427.23
Stop Loss 52179.49
TP1 52674.97
TP2 52922.72
TP3 53170.46
TP4 53418.20
VIP Clients Only
Active #129912
US30 30 Minutes
Buy
Entry 52290.22
Stop Loss 52172.10
TP1 52408.34
TP2 52526.45
TP3 52644.57
TP4 52762.69
TP2 Hit #129892
US30 1 Minute
Sell
Entry 52350.22
Stop Loss 52422.49
TP1 52277.95
TP2 52205.67
TP3 52133.40
TP4 52061.12
TP1 Hit #129890
US30 4 Hours
Buy
Entry 52364.23
Stop Loss 51866.08
TP1 52862.38
TP2 53360.52
TP3 53858.67
TP4 54356.82
VIP Clients Only
Active #129919
Trade Ledger

Last 20 Signals: US Indices

Date, time Order Price Take Profit Stop Loss State Entry Exit Profit
October 28, 2026 at 7:30 PM GMT Oct 28, 26 19:30 GMT Buy 52454.23 52571.47, 52688.72, 52805.96, 52923.21 52336.99 Active - - -
October 28, 2026 at 2:30 PM GMT Oct 28, 26 14:30 GMT Buy 52459.24 52703.99, 52948.75, 53193.50, 53438.25 52214.49 Active - - -
October 28, 2026 at 1:45 PM GMT Oct 28, 26 13:45 GMT Buy 52434.23 52513.35, 52592.46, 52671.58, 52750.70 52355.11 TP1 Hit 52434.23 52513.35 +791200
October 27, 2026 at 9:30 PM GMT Oct 27, 26 21:30 GMT Buy 52392.23 52771.01, 53149.80, 53528.58, 53907.36 52013.45 Active - - -
October 27, 2026 at 5:40 PM GMT Oct 27, 26 17:40 GMT Sell 52387.23 52359.25, 52331.28, 52303.30, 52275.33 52415.21 TP1 Hit 52387.23 52359.25 +279800
October 27, 2026 at 3:30 PM GMT Oct 27, 26 15:30 GMT Buy 52427.23 52674.97, 52922.72, 53170.46, 53418.20 52179.49 Active - - -
October 27, 2026 at 2:00 PM GMT Oct 27, 26 14:00 GMT Buy 52290.22 52408.34, 52526.45, 52644.57, 52762.69 52172.10 TP2 Hit 52290.22 52526.45 +2362300
October 27, 2026 at 1:45 PM GMT Oct 27, 26 13:45 GMT Sell 52350.22 52277.95, 52205.67, 52133.40, 52061.12 52422.49 TP1 Hit 52350.22 52277.95 +722700
October 26, 2026 at 9:30 PM GMT Oct 26, 26 21:30 GMT Buy 52364.23 52862.38, 53360.52, 53858.67, 54356.82 51866.08 Active - - -
October 26, 2026 at 8:30 PM GMT Oct 26, 26 20:30 GMT Buy 52364.23 52547.99, 52731.75, 52915.51, 53099.27 52180.47 TP1 Hit 52364.23 52547.99 +1837600
October 26, 2026 at 8:00 PM GMT Oct 26, 26 20:00 GMT Buy 52364.23 52476.85, 52589.47, 52702.10, 52814.72 52251.61 TP1 Hit 52364.23 52476.85 +1126200
October 26, 2026 at 8:00 PM GMT Oct 26, 26 20:00 GMT Sell 52364.23 52334.42, 52304.61, 52274.80, 52244.99 52394.04 TP2 Hit 52364.23 52304.61 +596200
October 26, 2026 at 4:20 PM GMT Oct 26, 26 16:20 GMT Sell 52365.25 52301.71, 52238.16, 52174.62, 52111.08 52428.79 TP1 Hit 52365.25 52301.71 +635400
October 26, 2026 at 2:30 PM GMT Oct 26, 26 14:30 GMT Buy 52525.26 53021.13, 53516.99, 54012.86, 54508.72 52029.39 Active - - -
October 26, 2026 at 2:00 PM GMT Oct 26, 26 14:00 GMT Buy 52395.23 52604.98, 52814.73, 53024.48, 53234.23 52185.48 TP1 Hit 52395.23 52604.98 +2097500
October 26, 2026 at 1:45 PM GMT Oct 26, 26 13:45 GMT Buy 52338.24 52371.32, 52404.40, 52437.48, 52470.57 52305.16 TP4 Hit 52338.24 52470.57 +1323300
October 23, 2026 at 9:30 PM GMT Oct 23, 26 21:30 GMT Buy 52214.21 52611.08, 53007.95, 53404.82, 53801.69 51817.34 TP1 Hit 52214.21 52611.08 +3968700
October 23, 2026 at 6:00 PM GMT Oct 23, 26 18:00 GMT Sell 52289.22 52249.37, 52209.53, 52169.68, 52129.83 52329.07 TP2 Hit 52289.22 52209.53 +796900
October 23, 2026 at 3:30 PM GMT Oct 23, 26 15:30 GMT Buy 52401.23 52776.50, 53151.78, 53527.05, 53902.33 52025.96 Active - - -
October 23, 2026 at 3:00 PM GMT Oct 23, 26 15:00 GMT Sell 52353.24 52283.81, 52214.39, 52144.96, 52075.54 52422.67 TP1 Hit 52353.24 52283.81 +694300
Binary Options

US30 Binary Signals

The binary options record for US30: strike, direction and expiry on every call, settled Win, Loss or Tie.

Performance

Recent Results: Binary Options

Wins and losses by day across the last 30 trading sessions. Filter to a symbol to isolate its track.

Monthly Summary: Binary Options Click to toggle
Month, Year Total (Payout pts) US30
Month-to-date 1,740 1,740
September 2026 1,525 1,525
August 2026 850 850
July 2026 240 240
June 2026 960 960

Binary Options Signal Cards

US30 30 Minutes
Call
Strike 52454.23
Expiry 30 Minutes
Strategy SB Rules v1
Win #130158
US30 1 Hour
Call
Strike 52392.23
Expiry 1 Hour
Strategy SB Rules v1
Win #130108
US30 30 Minutes
Call
Strike 52392.23
Expiry 30 Minutes
Strategy SB Rules v1
Win #130104
US30 4 Hours
Call
Strike 52364.23
Expiry 4 Hours
Strategy SB Rules v1
Win #129920
US30 5 Minutes
Put
Strike 52364.23
Expiry 5 Minutes
Strategy SB Rules v1
Win #129886
US30 4 Hours
Call
Strike 52214.21
Expiry 4 Hours
Strategy SB Rules v1
Win #129701
Trade Ledger

Last 20 Signals: Binary Options

Date, time Direction Strike Expiry State Result Payout
October 28, 2026 at 7:30 PM GMT Oct 28, 26 19:30 GMT Long 52454.23 30 Minutes Settled Win +85
October 27, 2026 at 8:30 PM GMT Oct 27, 26 20:30 GMT Long 52392.23 1 Hour Settled Win +85
October 27, 2026 at 8:00 PM GMT Oct 27, 26 20:00 GMT Long 52392.23 30 Minutes Settled Win +85
October 26, 2026 at 9:30 PM GMT Oct 26, 26 21:30 GMT Long 52364.23 4 Hours Settled Win +85
October 26, 2026 at 8:00 PM GMT Oct 26, 26 20:00 GMT Short 52364.23 5 Minutes Settled Win +85
October 23, 2026 at 9:30 PM GMT Oct 23, 26 21:30 GMT Long 52214.21 4 Hours Settled Win +85
October 19, 2026 at 9:30 PM GMT Oct 19, 26 21:30 GMT Long 51981.19 4 Hours Settled Win +85
October 19, 2026 at 8:30 PM GMT Oct 19, 26 20:30 GMT Long 51981.19 1 Hour Settled Win +85
October 16, 2026 at 9:30 PM GMT Oct 16, 26 21:30 GMT Long 51995.19 4 Hours Settled Win +85
October 16, 2026 at 8:30 PM GMT Oct 16, 26 20:30 GMT Long 51995.19 1 Hour Settled Win +85
October 15, 2026 at 8:00 PM GMT Oct 15, 26 20:00 GMT Long 52180.21 5 Minutes Settled Win +85
October 14, 2026 at 9:30 PM GMT Oct 14, 26 21:30 GMT Long 51635.15 4 Hours Settled Win +85
October 14, 2026 at 8:00 PM GMT Oct 14, 26 20:00 GMT Long 51635.15 30 Minutes Settled Win +85
October 14, 2026 at 2:30 PM GMT Oct 14, 26 14:30 GMT Short 51684.16 1 Hour Settled Win +85
October 13, 2026 at 9:30 PM GMT Oct 13, 26 21:30 GMT Long 51677.16 4 Hours Settled Loss -100
October 13, 2026 at 8:00 PM GMT Oct 13, 26 20:00 GMT Long 51677.16 30 Minutes Settled Win +85
October 13, 2026 at 3:30 PM GMT Oct 13, 26 15:30 GMT Short 51777.17 1 Hour Settled Win +85
October 12, 2026 at 8:00 PM GMT Oct 12, 26 20:00 GMT Long 51858.18 5 Minutes Settled Win +85
October 7, 2026 at 9:30 PM GMT Oct 7, 26 21:30 GMT Short 51173.11 4 Hours Settled Win +85
October 7, 2026 at 6:30 PM GMT Oct 7, 26 18:30 GMT Short 51227.11 1 Hour Settled Win +85
Futures

Dow Jones 30 (YM JUN26) Futures Signals

The futures record for Dow Jones 30 (YM JUN26): the same instrument traded on the exchange contract, with its own entry, stop and targets.

Performance

Recent Results: Futures

Per-symbol net percentage outcome by day across the last 30 trading sessions. Filter to a symbol to isolate its track.

Monthly Summary: Futures Click to toggle
Month, Year Total (Net %) YM JUN26
Month-to-date 65.0 65.0
September 2026 71.0 71.0
August 2026 112.0 112.0
July 2026 51.0 51.0
June 2026 160.0 160.0

Futures Signal Cards

YM JUN26 4 Hours
Buy
Entry 52626.00
Stop Loss 52363.27
TP1 52888.73
TP2 53151.46
TP3 53414.19
TP4 53676.92
TP1 Hit #130131
YM JUN26 4 Hours
Buy
Entry 52550.00
Stop Loss 52318.12
TP1 52781.88
TP2 53013.77
TP3 53245.65
TP4 53477.53
TP2 Hit #129952
YM JUN26 1 Hour
Buy
Entry 52520.00
Stop Loss 52401.60
TP1 52638.40
TP2 52756.80
TP3 52875.19
TP4 52993.59
TP1 Hit #129900
YM JUN26 1 Hour
Buy
Entry 52528.00
Stop Loss 52412.15
TP1 52643.85
TP2 52759.71
TP3 52875.56
TP4 52991.42
TP2 Hit #129743
YM JUN26 1 Hour
Buy
Entry 52785.00
Stop Loss 52623.58
TP1 52946.42
TP2 53107.83
TP3 53269.25
TP4 53430.67
TP2 Hit #129107
YM JUN26 4 Hours
Buy
Entry 52710.00
Stop Loss 52455.84
TP1 52964.16
TP2 53218.31
TP3 53472.47
TP4 53726.63
TP1 Hit #129077
Trade Ledger

Last 20 Signals: Futures

Date, time Order Price Take Profit Stop Loss State Entry Exit Profit
October 28, 2026 at 2:00 PM GMT Oct 28, 26 14:00 GMT Buy 52626.00 52888.73, 53151.46, 53414.19, 53676.92 52363.27 TP1 Hit 52626.00 52888.73 +2627300
October 27, 2026 at 6:00 PM GMT Oct 27, 26 18:00 GMT Buy 52550.00 52781.88, 53013.77, 53245.65, 53477.53 52318.12 TP2 Hit 52550.00 53013.77 +4637700
October 27, 2026 at 3:00 PM GMT Oct 27, 26 15:00 GMT Buy 52520.00 52638.40, 52756.80, 52875.19, 52993.59 52401.60 TP1 Hit 52520.00 52638.40 +1184000
October 26, 2026 at 9:00 PM GMT Oct 26, 26 21:00 GMT Buy 52528.00 52643.85, 52759.71, 52875.56, 52991.42 52412.15 TP2 Hit 52528.00 52759.71 +2317100
October 22, 2026 at 3:00 PM GMT Oct 22, 26 15:00 GMT Buy 52785.00 52946.42, 53107.83, 53269.25, 53430.67 52623.58 TP2 Hit 52785.00 53107.83 +3228300
October 22, 2026 at 10:00 AM GMT Oct 22, 26 10:00 GMT Buy 52710.00 52964.16, 53218.31, 53472.47, 53726.63 52455.84 TP1 Hit 52710.00 52964.16 +2541600
October 19, 2026 at 4:00 PM GMT Oct 19, 26 16:00 GMT Buy 52301.00 52571.71, 52842.43, 53113.14, 53383.85 52030.29 TP3 Hit 52301.00 53113.14 +8121400
October 18, 2026 at 11:00 PM GMT Oct 18, 26 23:00 GMT Buy 52356.00 52701.60, 53047.20, 53392.80, 53738.40 52010.40 TP2 Hit 52356.00 53047.20 +6912000
October 16, 2026 at 12:00 PM GMT Oct 16, 26 12:00 GMT Buy 52407.00 52509.28, 52611.55, 52713.83, 52816.11 52304.72 TP4 Hit 52407.00 52816.11 +4091100
October 15, 2026 at 10:00 AM GMT Oct 15, 26 10:00 GMT Sell 52017.00 51799.78, 51582.56, 51365.34, 51148.13 52234.22 Loss 52017.00 52234.22 -2172200
October 14, 2026 at 9:00 PM GMT Oct 14, 26 21:00 GMT Buy 51846.00 52110.02, 52374.04, 52638.06, 52902.09 51581.98 TP4 Hit 51846.00 52902.09 +10560900
October 5, 2026 at 10:00 PM GMT Oct 5, 26 22:00 GMT Sell 51598.00 51348.14, 51098.28, 50848.43, 50598.57 51847.86 Loss 51598.00 51847.86 -2498600
October 5, 2026 at 2:00 AM GMT Oct 5, 26 02:00 GMT Sell 51499.00 51156.46, 50813.92, 50471.38, 50128.84 51841.54 TP1 Hit 51499.00 51156.46 +3425400
October 2, 2026 at 10:00 PM GMT Oct 2, 26 22:00 GMT Sell 51485.00 51126.64, 50768.28, 50409.93, 50051.57 51843.36 Loss 51485.00 51843.36 -3583600
September 27, 2026 at 11:00 PM GMT Sep 27, 26 23:00 GMT Sell 52003.00 51765.08, 51527.16, 51289.23, 51051.31 52240.92 TP4 Hit 52003.00 51051.31 +9516900
September 23, 2026 at 7:00 AM GMT Sep 23, 26 07:00 GMT Sell 52342.00 52252.28, 52162.56, 52072.83, 51983.11 52431.72 TP4 Hit 52342.00 51983.11 +3588900
September 22, 2026 at 6:00 PM GMT Sep 22, 26 18:00 GMT Sell 52281.00 51681.56, 51082.13, 50482.69, 49883.25 52880.44 TP2 Hit 52281.00 51082.13 +11988700
September 21, 2026 at 2:00 AM GMT Sep 21, 26 02:00 GMT Sell 52210.00 51806.07, 51402.14, 50998.22, 50594.29 52613.93 Loss 52210.00 52613.93 -4039300
September 18, 2026 at 9:00 PM GMT Sep 18, 26 21:00 GMT Sell 52138.00 51981.57, 51825.14, 51668.71, 51512.27 52294.43 Loss 52138.00 52294.43 -1564300
September 18, 2026 at 8:00 PM GMT Sep 18, 26 20:00 GMT Sell 52114.00 51930.32, 51746.63, 51562.95, 51379.27 52297.68 Loss 52114.00 52297.68 -1836800
FAQs

Common questions about Dow Jones 30 (US30) signals

How fast do signals reach me?

Every signal pushes to you in under 10 milliseconds from when our engine fires. It lands on the web dashboard, Telegram, our browser extension, and the mobile app at the same time, so you never miss an entry.

What US indices markets do you cover?

Every US indices instrument with a live track record shows up as a card on this page, busiest first. Tap any card to open its full signal history.

What's inside each signal?

A clear direction (Buy or Sell), an entry price, a protective stop loss, and take-profit targets, plus a live status that updates as the trade plays out.

How should I size each trade?

We suggest risking 1–2% of your account per trade. Your position size then follows from the stop distance on each signal and the risk percentage you're comfortable with.

Where can I see past results?

Right on this page: the Recent Results chart and the full statistics panel above show every tracked outcome. We publish the complete record, wins and losses alike.

How will I receive signals?

Through whichever channels suit you: the web dashboard, Telegram, our browser extension, and the mobile app all stay in sync, so each signal reaches you wherever you are.

How do I get VIP access?

VIP access comes with every plan; message our team and we'll set you up.

Do you guarantee profits?

No, and be wary of anyone who does. US Indices trading carries substantial risk. Read our Risk Warning and judge the historical edge for yourself before subscribing.

Can I cancel any time?

Yes. Cancel in one click from your dashboard, no hidden fees and no auto-renewal traps.

Still have questions?

Our team is happy to help before you join; get in touch and we'll walk you through anything you're unsure about.

Trend and swing stop

US30 Trading Signals for the Price-Weighted Dow

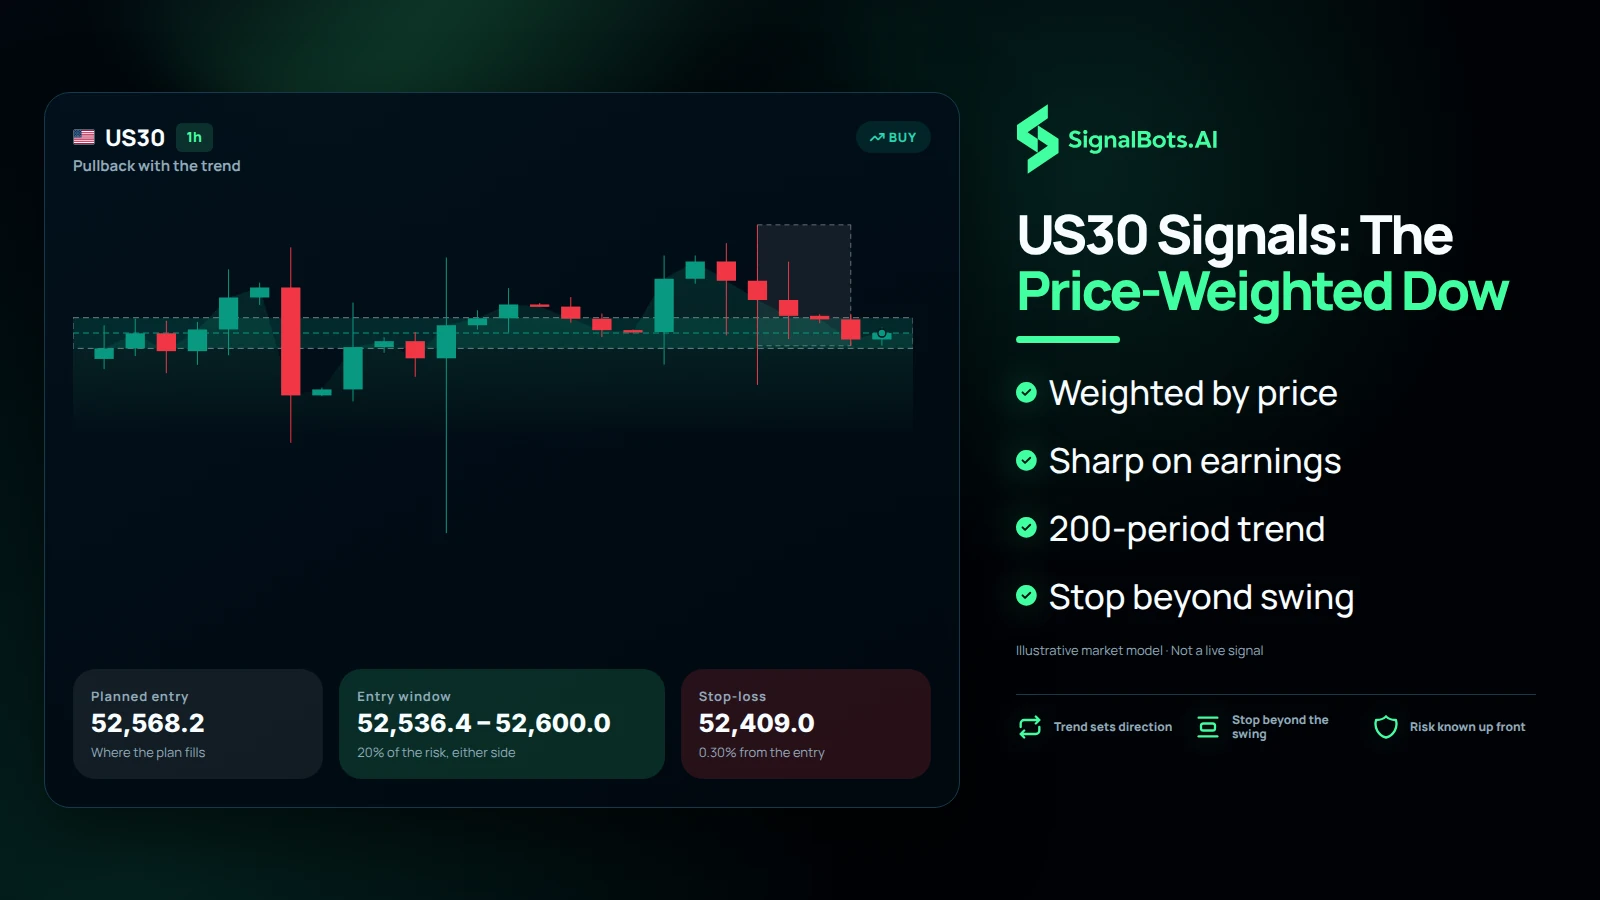
The Dow Jones Industrial Average follows just 30 large US companies and weights them by share price rather than market value, so a single high-priced stock can move the index more than a much larger company. That makes US30 react sharply to individual earnings and news. Each signal reads the Dow's trend against its 200-period average and places the stop beyond its latest ten-candle swing.

Dark illustration headed "US30 Signals: The Price-Weighted Dow" showing a 1h US30 buy chart labelled "Pullback with the trend" with a shaded entry window, cards for planned entry, entry window and stop-loss, and bullets on price weighting, earnings moves, the 200-period trend and the stop beyond the swing.
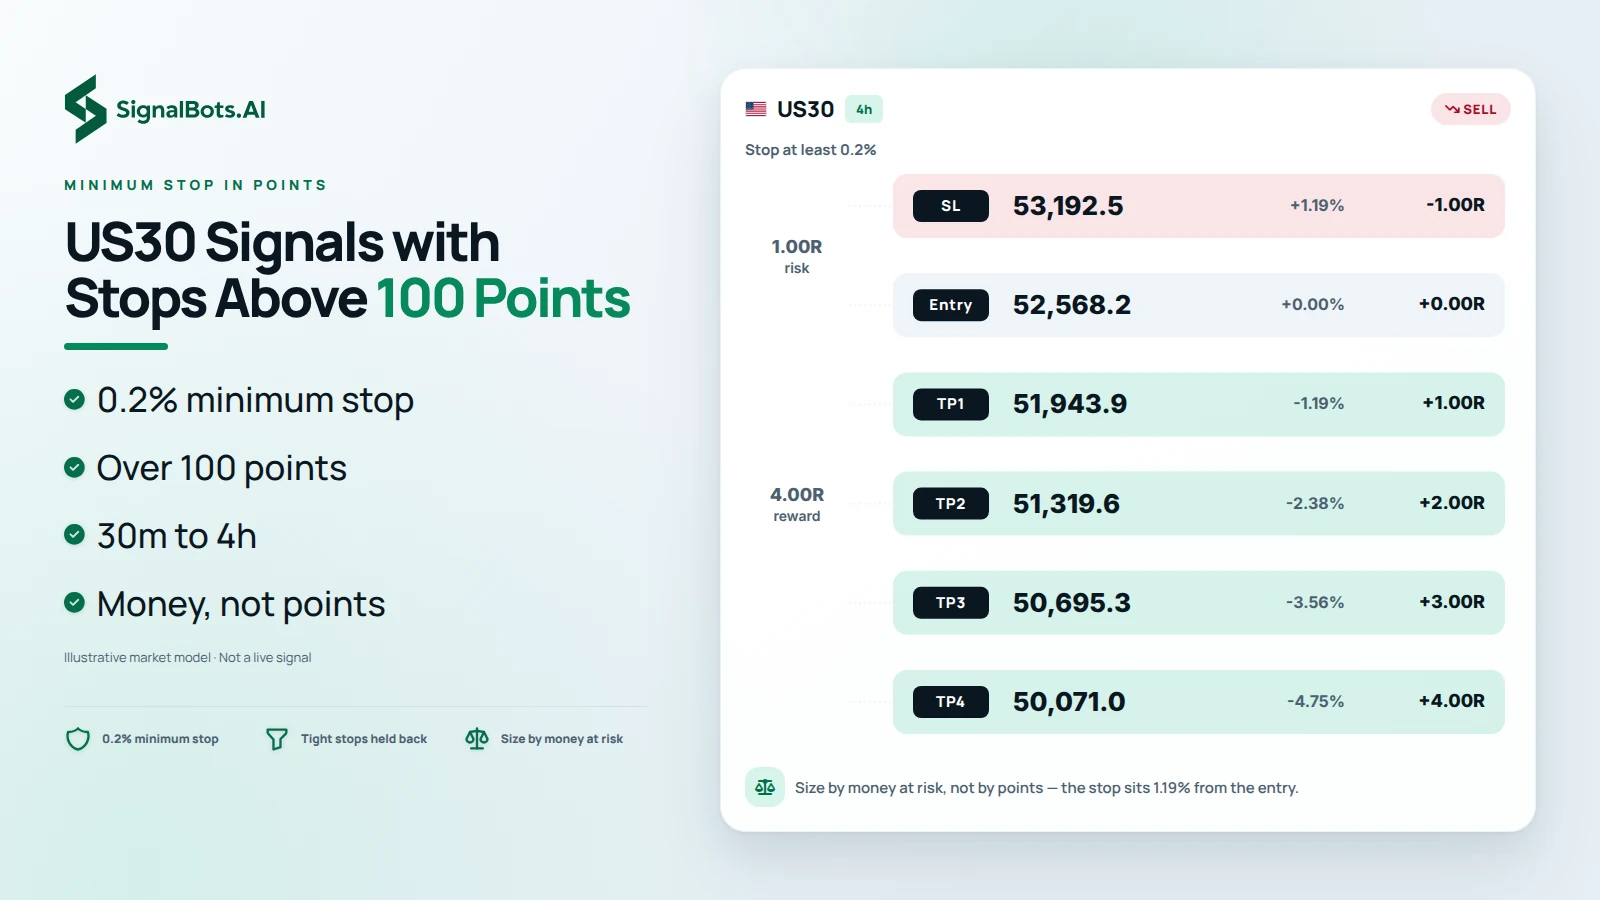
Light illustration headed "US30 Signals with Stops Above 100 Points" showing a 4h US30 sell plan drawn to scale with its stop-loss, entry and four take-profits from 1R to 4R, a note to size by money at risk rather than points, and bullets on the 0.2% minimum stop from 30m to 4h.

Minimum stop in points

US30 Signals with Stops Above 100 Points

With the Dow above 50,000, a 0.2% minimum stop on the 30m, 1h and 4h charts comes to more than 100 points. Setups with tighter stops are held back on those charts because costs would take too much of the risk. Point figures on US30 look large next to the S&P 500's, but in percentage terms the stops are comparable, so size by the money at risk rather than by the number of points.

Separate market records

Dow Jones Futures (YM) and US30 Binary Signals

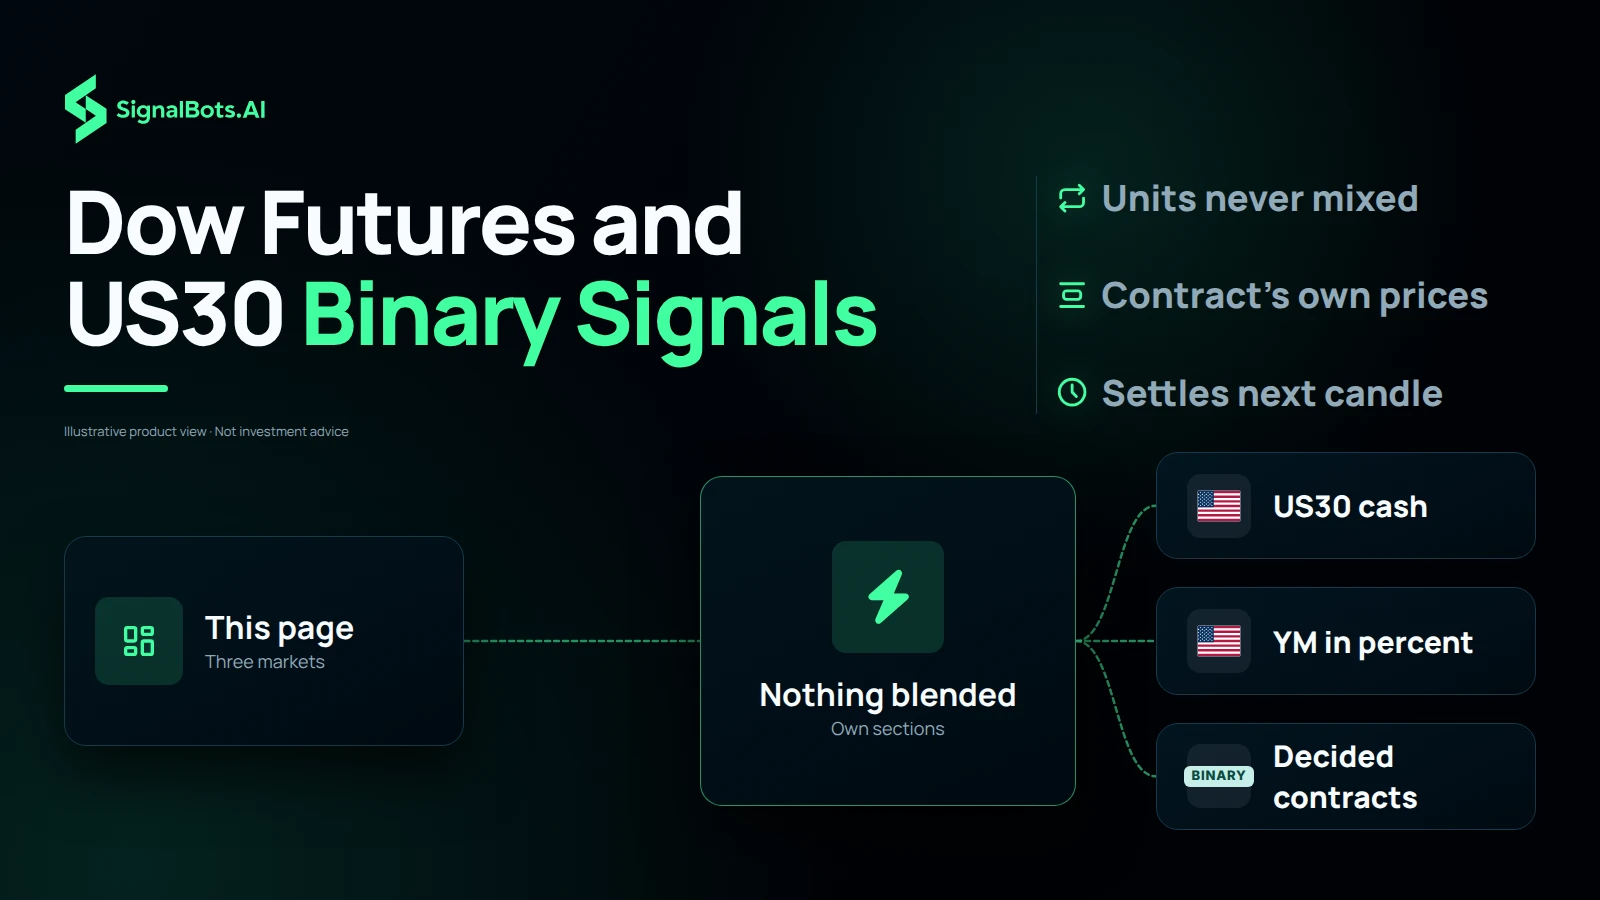
Two more Dow markets are signalled on this page. The CME E-mini Dow futures contract, YM, is read from its own prices and can produce setups outside cash-market hours, with results tracked as percentage moves. US30 binary options signals use the index's direction rule, set the strike at the signal candle's close and settle one candle later. Each has its own section, so no result is blended with the cash index record.

Dark flow diagram headed "Dow Futures and US30 Binary Signals" in which a "This page" card feeds a "Nothing blended" hub that splits into three cards, US30 cash, YM in percent and binary decided contracts, beside notes that units are never mixed, futures use the contract's own prices and binaries settle next candle.
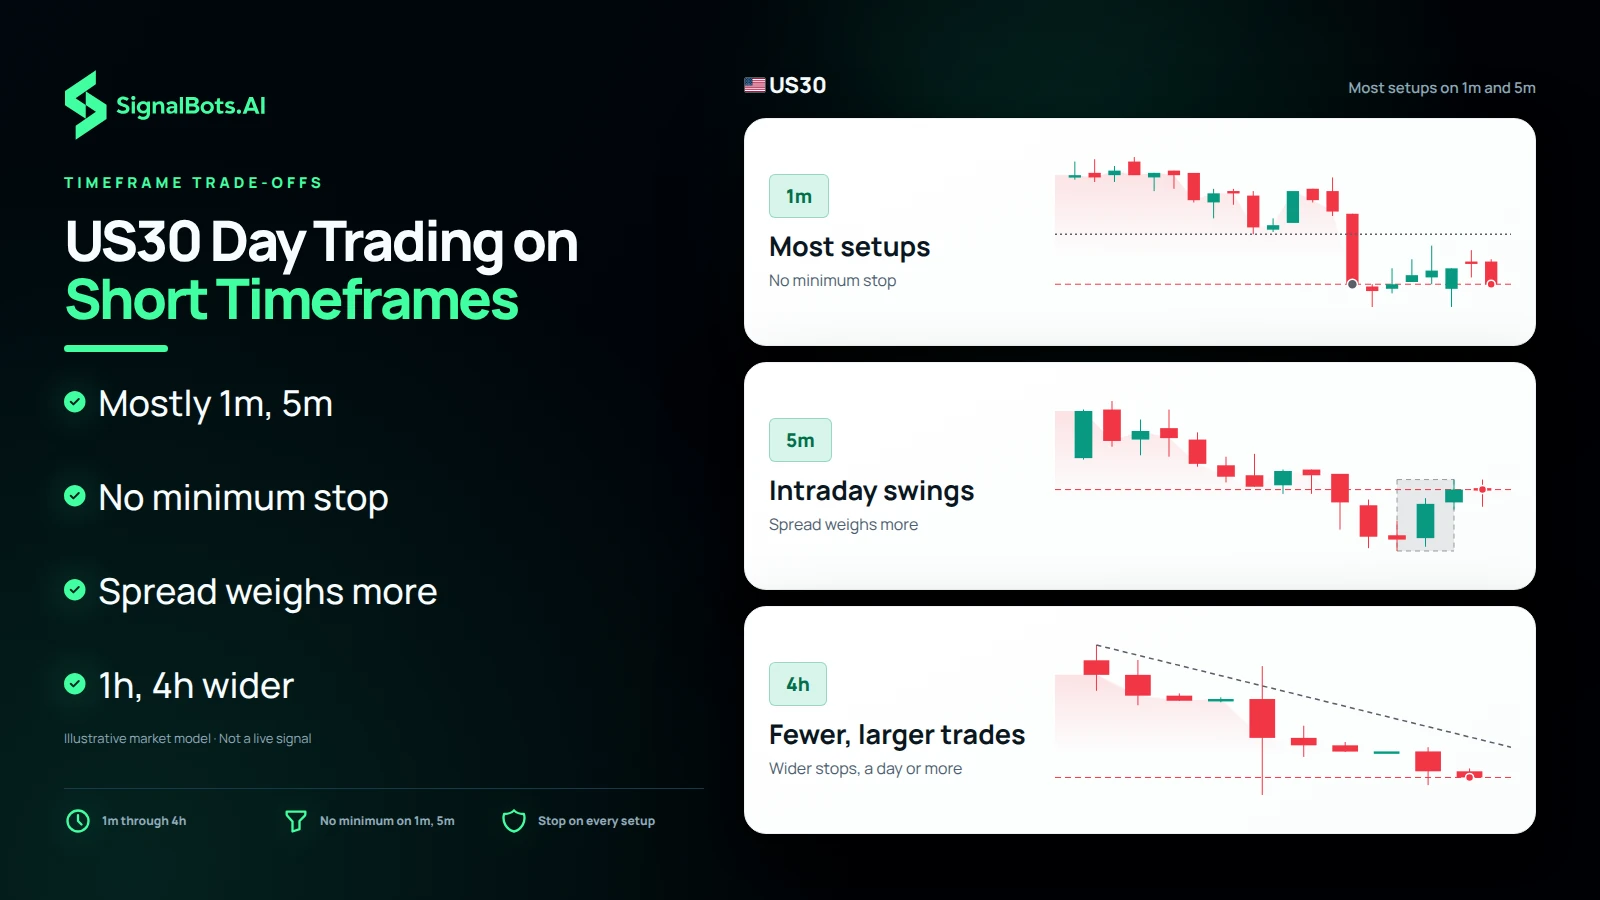
Duotone illustration headed "US30 Day Trading on Short Timeframes" stacking three US30 chart rungs: 1m "Most setups" with no minimum stop, 5m "Intraday swings" where the spread weighs more, and 4h "Fewer, larger trades" with wider stops, beside bullets on short charts and wider 1h and 4h stops.

Timeframe trade-offs

US30 Day Trading Signals on Short Timeframes

Most Dow setups come from the 1m and 5m charts, where the index's intraday swings are traded within the session. These charts have no minimum stop distance, so setups appear more often, but the spread becomes a bigger share of every target. If you prefer fewer, larger trades, the 1h and 4h US30 setups carry wider stops and aim for moves that can take a day or more.

How trades are scored

US30 Signal Results and How Expired Trades Count

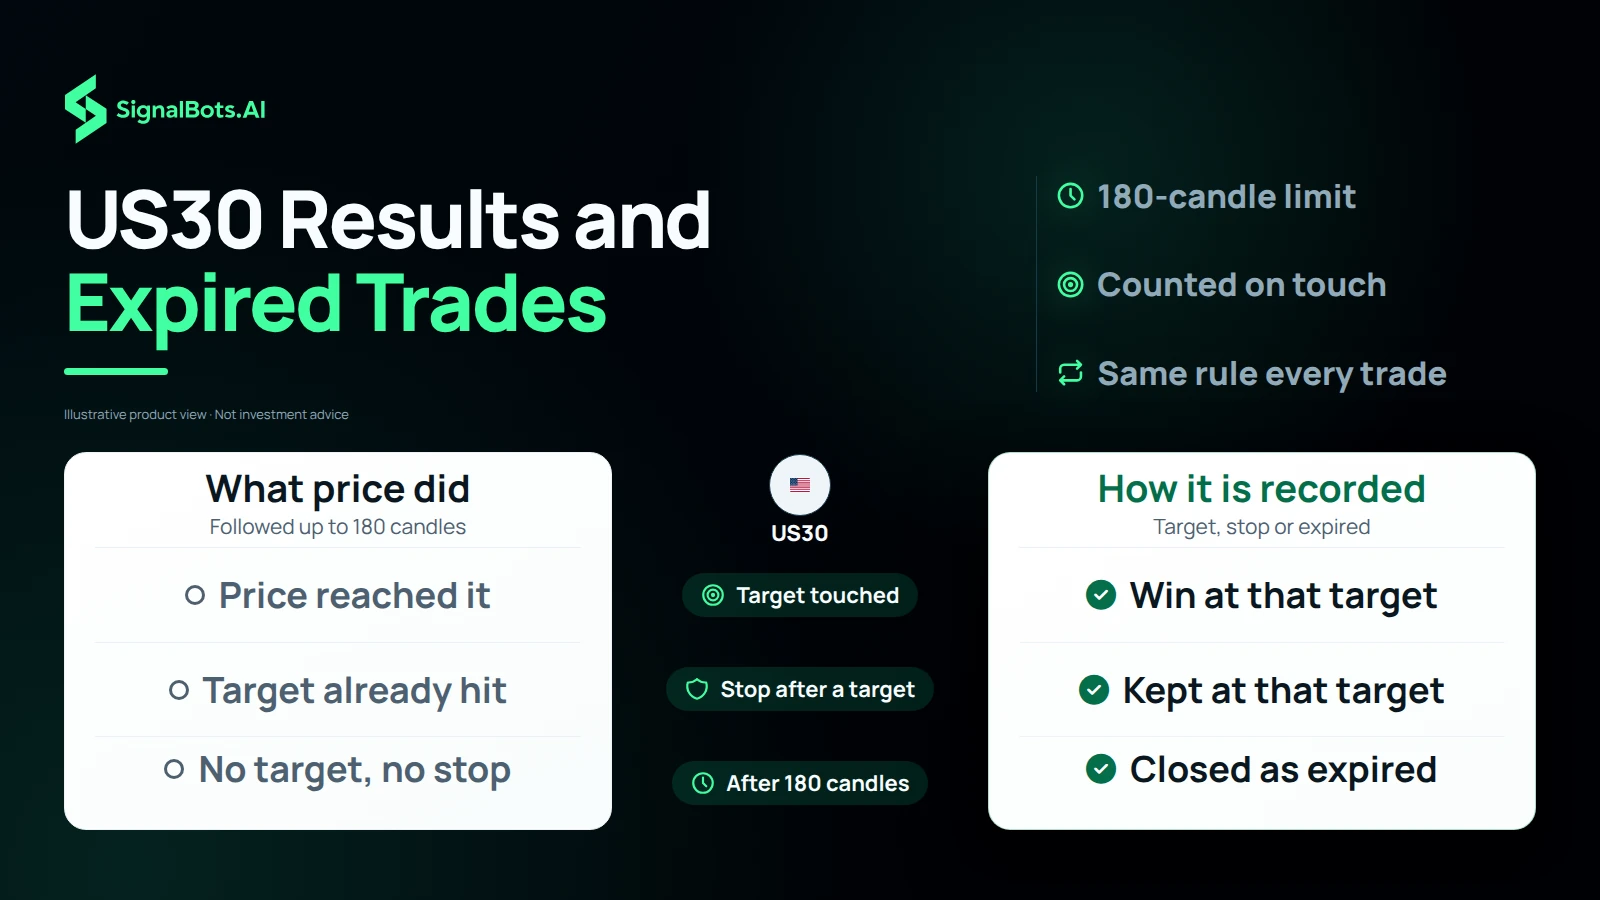
A Dow trade that goes nowhere is neither quietly counted as a win nor dropped. Each US30 signal is followed for up to 180 candles, and one that reaches neither a target nor its stop is closed and labelled expired. A take-profit is recorded the moment it is touched, and a stop that arrives afterward keeps the trade at that target, so every result in the history means the same thing.

Duotone table headed "US30 Results and Expired Trades" comparing what price did with how it is recorded: a touched target is a win at that target, a stop after a target keeps the trade at that target, and 180 candles with neither closes it as expired.

Win Rate

Wins vs losses
78%
Win Rate

Gain Chart

Cumulative growth over the last 120 days
Past performance is not indicative of future results. US Indices trading carries substantial risk. Review our Risk Warning before subscribing.
ROI Calculator

What if you traded with us?

Move the slider: see the cumulative return our tracked signals produced over the last 7 days, applied to your starting capital.

Starting $1,000
After last 7 days $1,760 +$760
Hypothetical, based on historical Win Rate. Not a guarantee of future returns.
+2002.59%
Total Gain
14.76%
Max Drawdown
+$170705.0
Net Profit
Full Advanced Statistics Click to expand

Advanced Statistics

Updated Oct 29, 2026 · 11:10 GMT
Balance $180705.0
Equity (100.00%) $180705.0
Floating PL $0.0
Deposits $10000.0
Withdrawals $0
Trades 634
Pips 170705000
Won 93%
Avg. Trade Time
Lots 82.42
Profit Factor 6.78
Daily 3.16%
Monthly 94.84%
Trades Per Month 35
Expectancy 5617069.3 Pips / $5617.07
Built for your broker

Keep your broker. Keep your edge.

No switching accounts, no relearning a platform. Whichever forex broker you already trade with, these signals plug straight in. Read them here, or let our extensions, robots and connectors act on them for you.

Trusted by traders

What Dow Jones 30 (US30) Traders Are Saying

A Dow Jones 30 (US30) trade plan I can check before acting

On the US Indices signals page, the Dow Jones 30 (US30) entry, stop and targets give me a defined checklist instead of a rushed decision.

Yui Takahashi
Yui Takahashi Japan

Dow Jones 30 (US30) history makes the process easier to review

I use the US Indices Recent Results and Dow Jones 30 (US30) monthly table to study the setup before I decide whether it fits my own risk plan.

Khalid Al Marzooqi
Khalid Al Marzooqi United Arab Emirates

Dow Jones 30 (US30) levels help me avoid chasing

Seeing the US Indices Dow Jones 30 (US30) stop alongside the target keeps me patient when price is already moving quickly.

Valeria Lopez
Valeria Lopez Mexico

Dow Jones 30 (US30) context without hiding the risk

The US Indices Dow Jones 30 (US30) page makes the outcome history visible, so I can keep position size and risk limits under my own control.

Mariam Al Marri
Mariam Al Marri Qatar

One focused view for Dow Jones 30 (US30)

The US Indices Dow Jones 30 (US30) alerts and symbol filters make it much easier to follow the instruments I actually trade.

Rahim Uddin
Rahim Uddin Bangladesh

Ready to trade Dow Jones 30 (US30) with us?

Full access to every signal, with instant alerts on the web, Telegram, our extension and mobile app.

No card needed
VIP Access $49/mo · 7-day free trial