Multi-asset · VIP access

XHMaster & XMaster Formula Indicator

See momentum weaken before price turns

A TradingView indicator that merges the Xmaster and XHMaster formulas with regular divergence, dynamic price bands and a five-timeframe dashboard, so you catch momentum fading first, then a reversal or continuation signal that's already confirmed across timeframes.

View on TradingView

$48.88/mo on TradingView, free or discounted for SignalBots members.

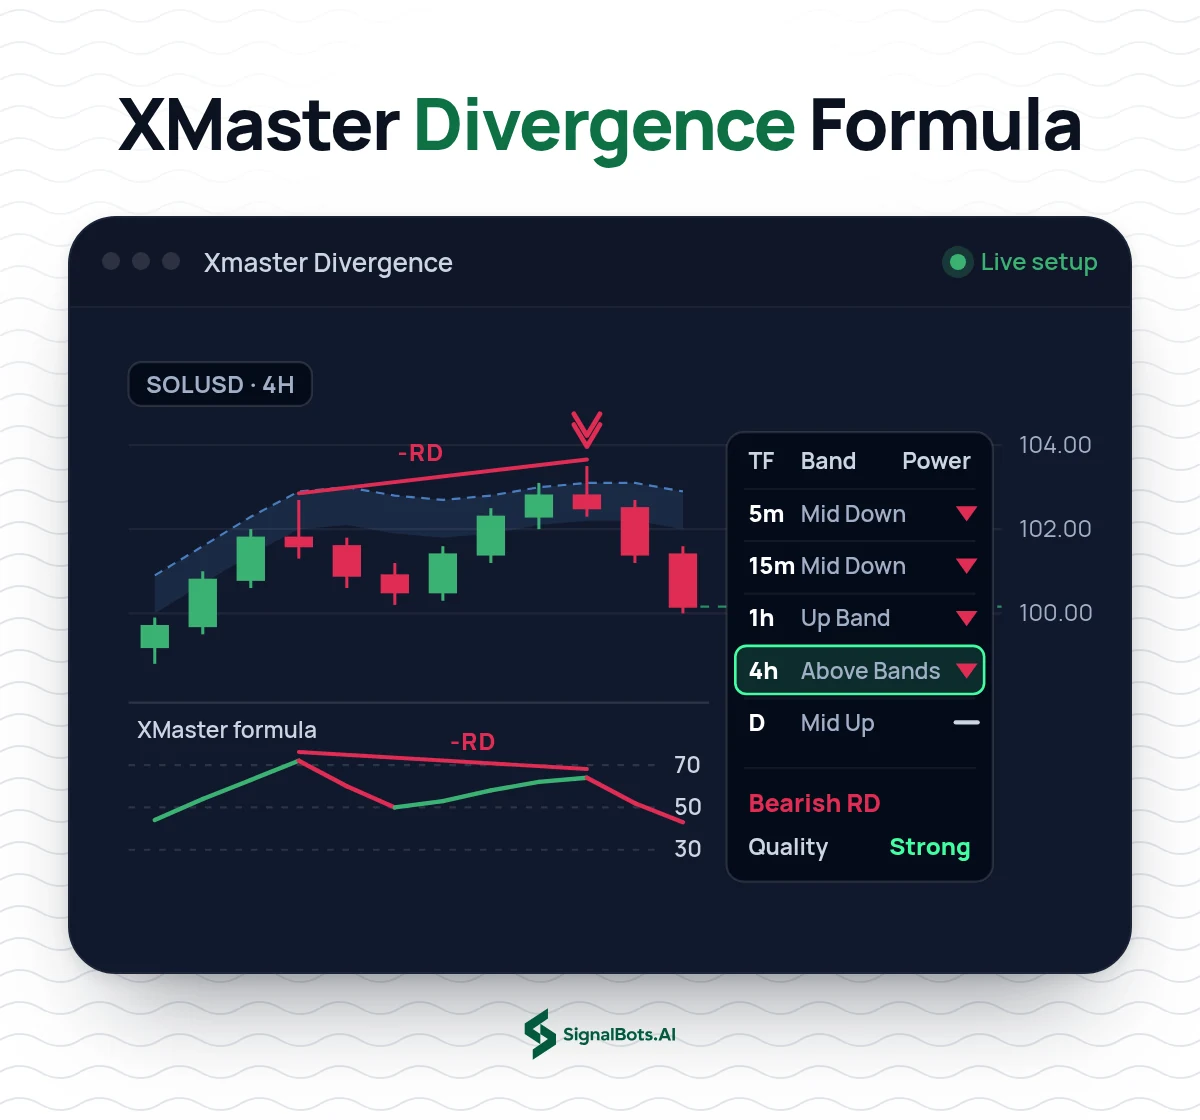
XHMaster & XMaster Formula Indicator on a SOLUSD 4H chart: price makes a higher high while the XMaster formula line makes a lower high, marked as regular bearish divergence (-RD) with a reversal mark, and a five-timeframe dashboard shows band position and trend power from 5m to daily with the divergence graded Strong.
Step-by-Step Setup

Unlock Xmaster Divergence free in 3 steps

Follow the steps in order. Open an eligible partner account the right way, get your free VIP license, then learn how to read and trade the indicator on TradingView.

Step 1 of 3

XM Sign Up

Which describes you?

Already on XM? Move your account

Already have a XM account? Move it under our partner link in a few steps so it qualifies for free VIP access to Xmaster Divergence: the guide shows the safe way.

Momentum fading first

XMaster Formula Indicator That Shows Momentum Fading First

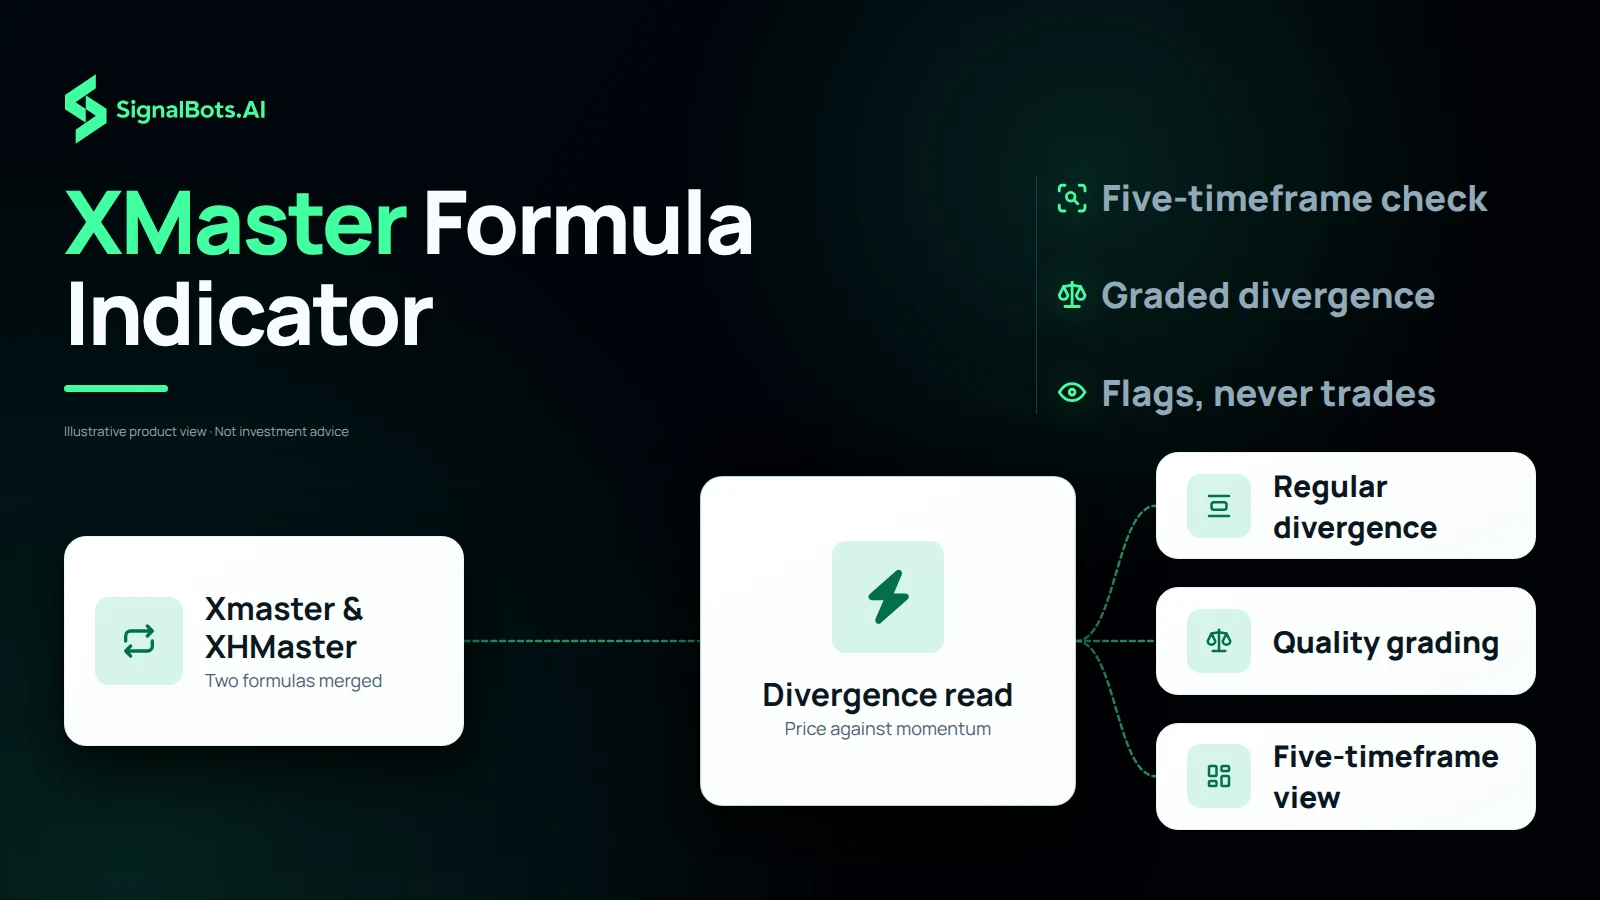
The XHMaster & XMaster Formula Indicator is an invite-only TradingView script that merges the Xmaster and XHMaster formulas with regular divergence, dynamic price bands and a dashboard that reads five timeframes. Its job is to show you momentum weakening before price turns. Price and momentum usually move together; when they split, the indicator marks the divergence, grades how strong it is, and frames the turn with a reversal or continuation arrow that has already been checked across timeframes. You catch momentum fading first instead of reacting after the move. It flags setups, and the trade decision stays yours.

A flow from the merged Xmaster and XHMaster formulas, through the indicator that grades the split between price and momentum, out to regular divergence, quality grading and the five-timeframe dashboard.
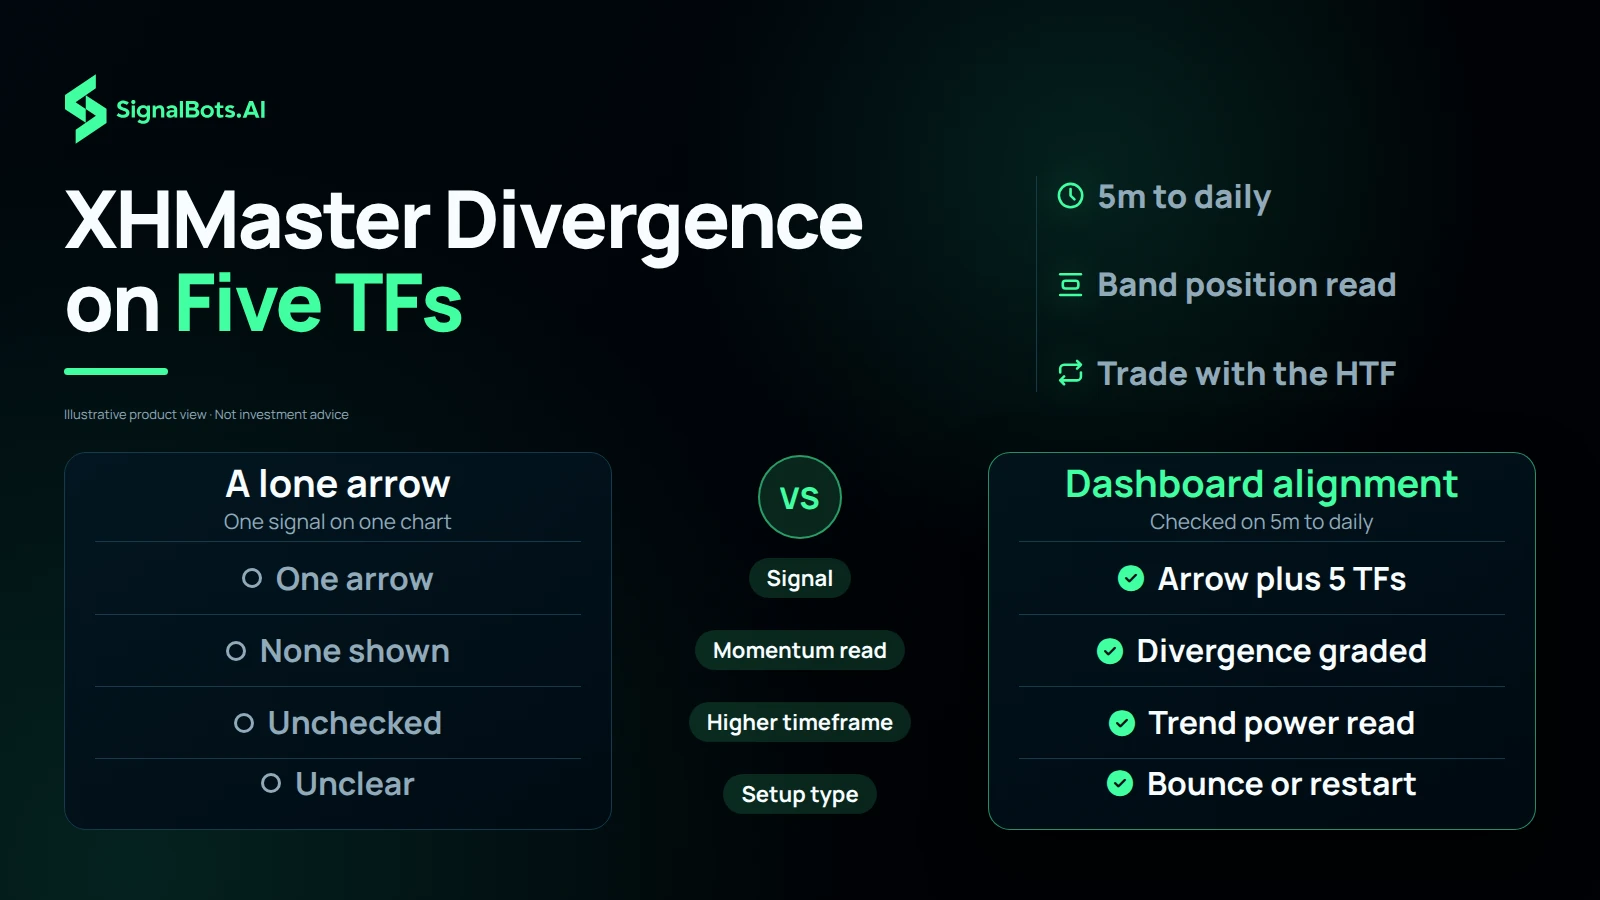
Left column: a lone arrow on one chart with no momentum read and no higher-timeframe check. Right column: the same arrow checked on a dashboard of 5m, 15m, 1h, 4h and daily with band position and trend power.

Alignment over arrows

XHMaster Divergence on a Five-Timeframe Dashboard, Not One Arrow

A single arrow on one chart cannot tell you whether the rest of the market agrees with it. The XHMaster & XMaster indicator cross-checks every reversal and continuation arrow against a five-timeframe dashboard that reads band position and trend power on the 5m, 15m, 1h, 4h and daily charts at once. Before you act on a 5m arrow, you can see whether the 1h and daily picture points the same way, so you trade with the higher timeframe rather than against it. You act on alignment, not a lone arrow, but alignment is context rather than a promise, and trading carries risk of loss.

How a turn forms

Regular Bullish and Bearish Divergence Before Price Turns

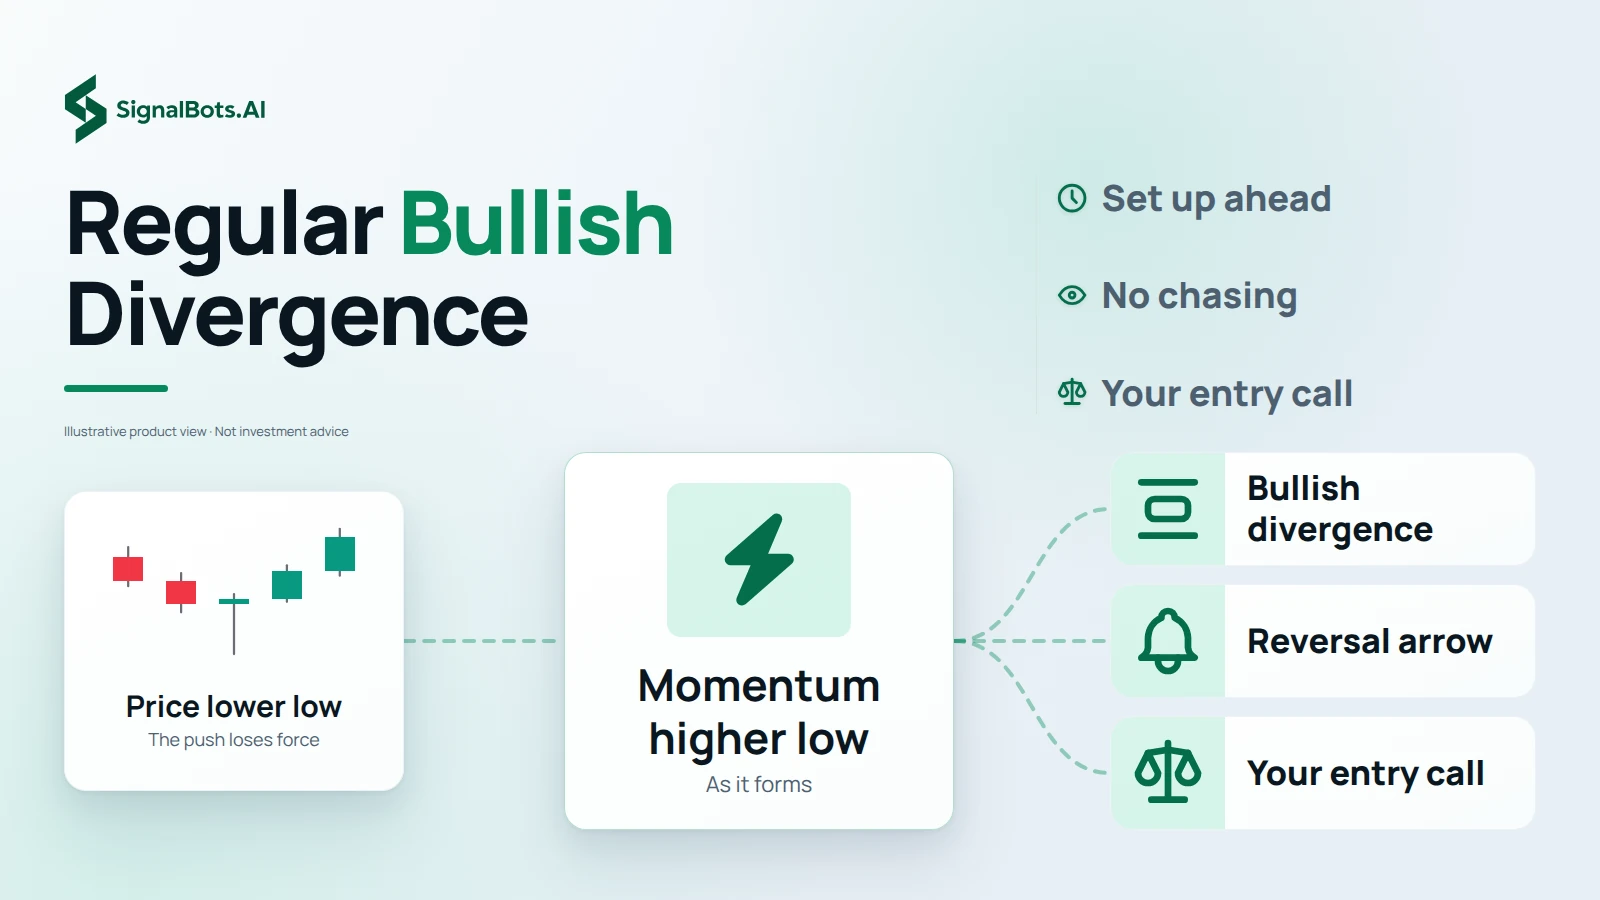
A divergence signal starts with a split between price and momentum. In a regular bullish divergence, price prints a lower low while momentum prints a higher low, a sign that the push lower has less force behind it; a regular bearish divergence is the mirror image, with momentum making a lower high while price makes a higher high. The indicator marks that split as it forms, so fading momentum shows up before price rolls over and you are set up ahead of the move instead of chasing it. A reversal arrow then frames the turn, and the entry remains your call.

A flow from price printing a lower low, through momentum printing a higher low instead, out to the bullish divergence, the reversal arrow and the entry the trader still calls.
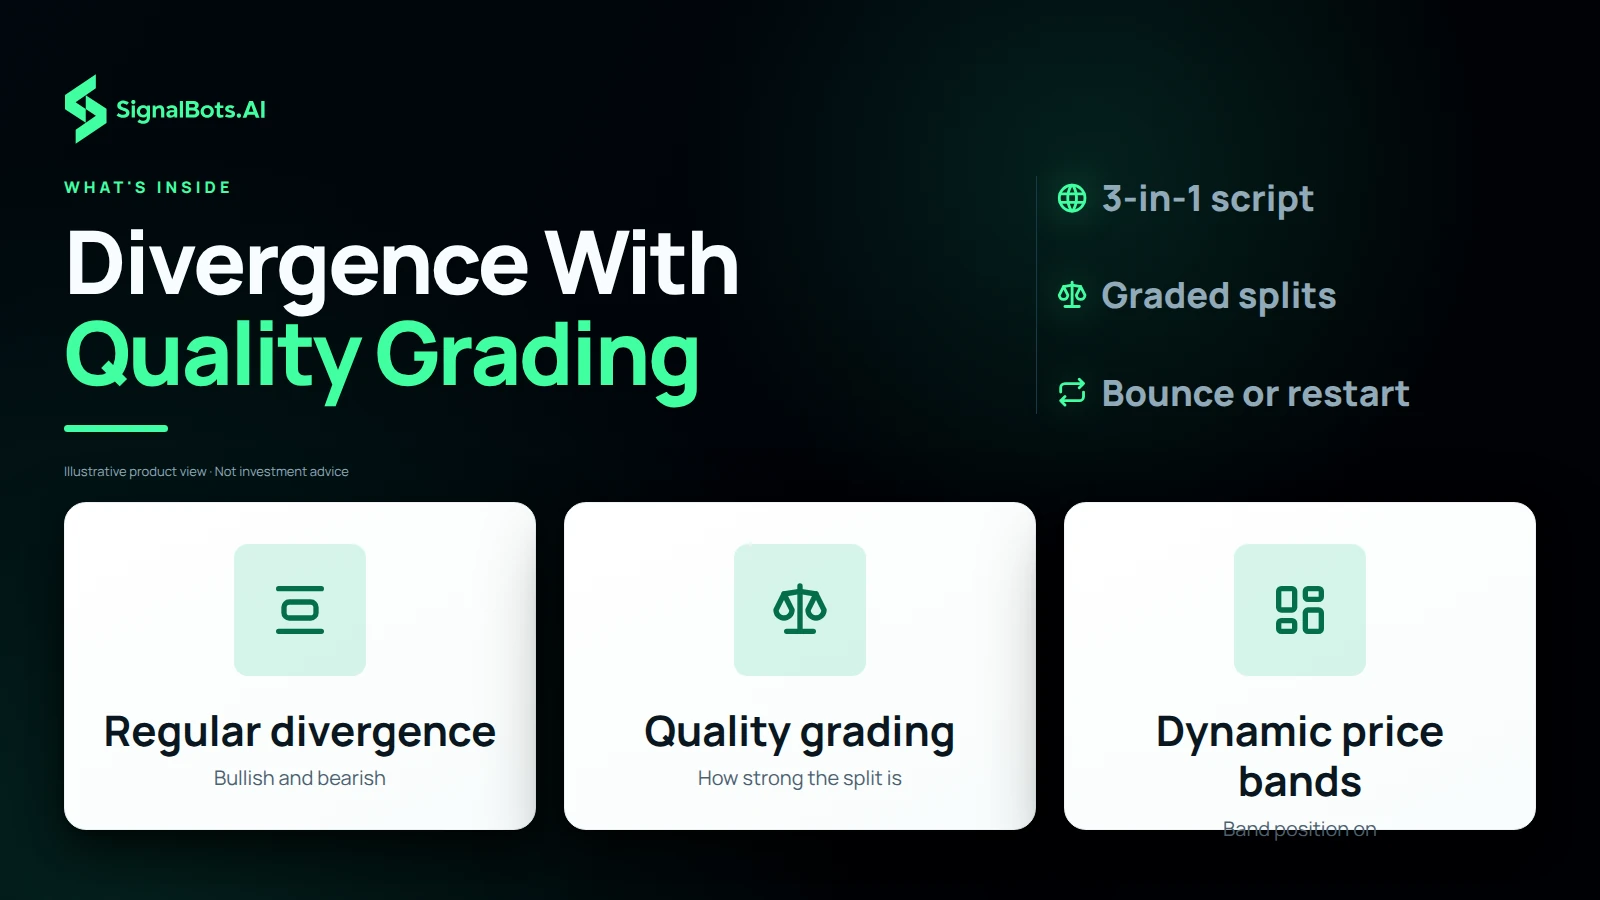
Three tiles: regular divergence, bullish and bearish; divergence quality grading, how strong the split is; dynamic price bands, with band position read on the dashboard.

What's inside

Divergence Indicator With Quality Grading and Dynamic Price Bands

Inside this 3-in-1 divergence indicator sit three reads, plus the arrows that turn them into a setup. Regular bull and bear divergence marks where momentum splits from price. Divergence quality grading rates how strong each split is, so you can weigh one against another instead of treating every divergence alike. Dynamic price bands add a second layer, and the dashboard tracks where price sits within them on each timeframe. Separate reversal and continuation arrows then tell a bounce from a genuine trend restart, so you always know which setup you are in and can pick the one your plan allows.

Who it suits

Divergence Trading for Reversal and Multi-Timeframe Traders

Divergence trading on this indicator suits divergence and momentum traders, reversal traders and multi-timeframe traders who want the higher timeframe on their side. It reads forex majors and gold, where momentum divergence is textbook, BTC and liquid alts through fast momentum shifts, and indices, stocks and commodities with a clean momentum read, on anything from scalping to swing. Free VIP access runs through XM: tell support, move an existing XM account under the partner link or open a new one, and share your TradingView username so the script appears in your Favorites. It flags setups, never places trades, and trading carries risk of loss.

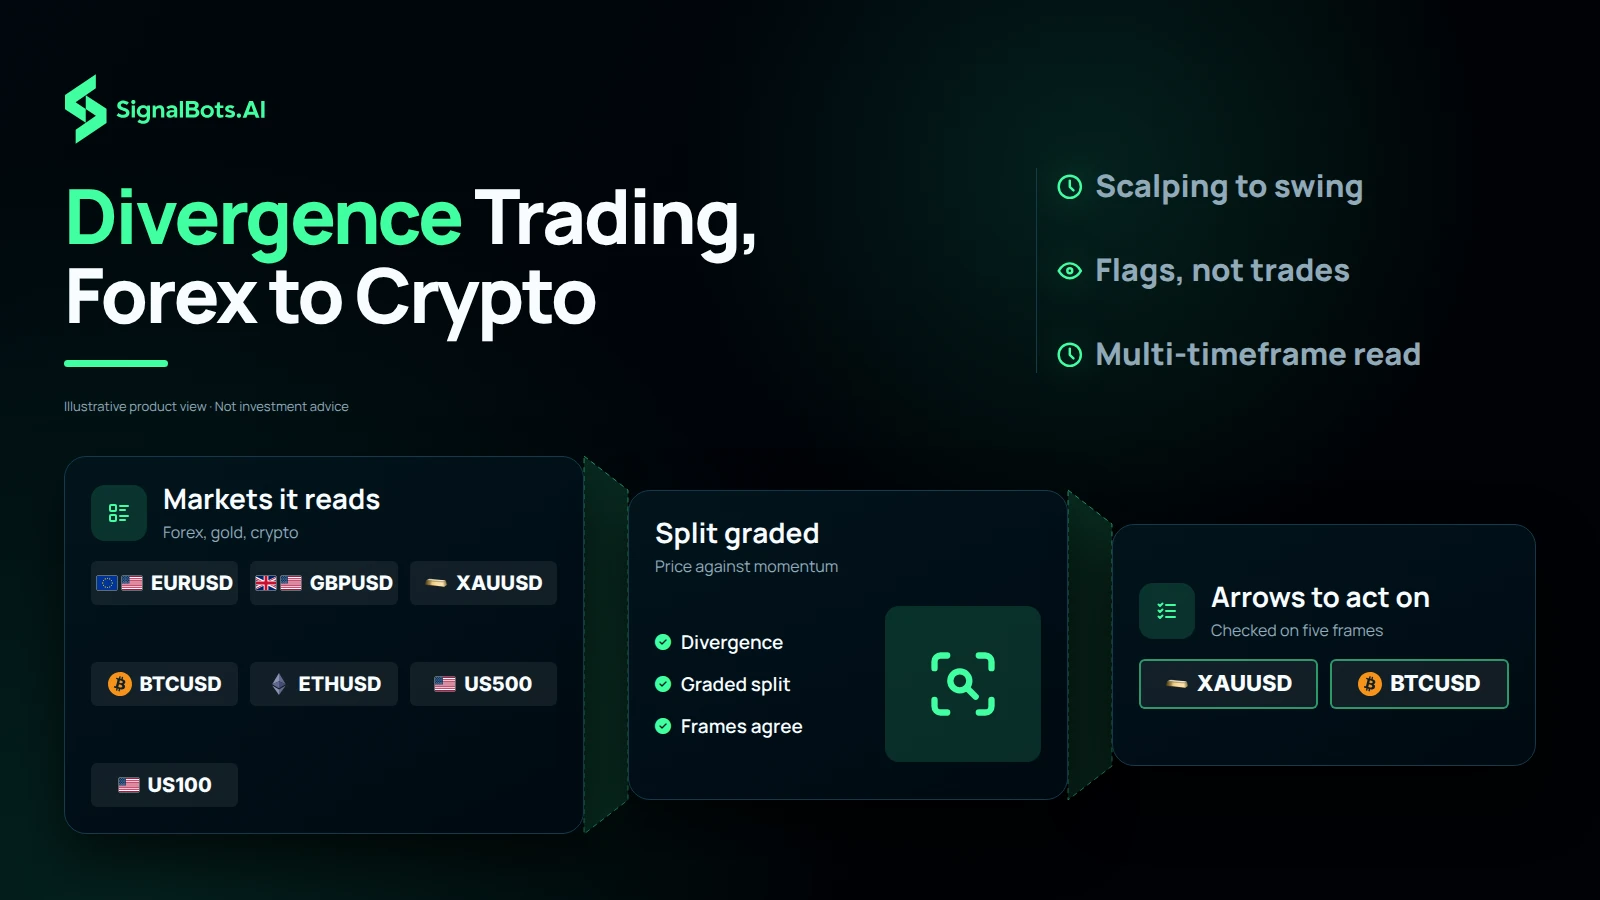
Seven forex, gold, crypto and index symbols pass the markets it reads, the graded split between price and momentum, and the five-frame check, leaving two arrows to act on.

On the chart

Xmaster Divergence in action

Live chart from Xmaster Divergence on TradingView.
How it works

What Xmaster Divergence does

Price and momentum usually move together, until they don't. This TradingView indicator is a 3-in-1 tool that marks regular bullish and bearish divergence, grades how strong it is, and frames the turn with reversal and continuation arrows, each cross-checked against a five-timeframe dashboard, so you act on alignment, not a lone arrow.

  1. 1

    Momentum diverges from price: higher lows under lower lows (bullish), lower highs under higher highs (bearish).

  2. 2

    Dynamic price bands show whether price sits mid-range or stretched to an extreme.

  3. 3

    Trend Power and the five-timeframe dashboard confirm a reversal or continuation before it fires.

Why traders use it

What you get out of it

  • Catch the turn early

    Divergence flags fading momentum before price rolls over, so you're set up ahead of the move, not chasing it.

  • Five timeframes, one view

    A dashboard reads band position and trend power from 5m to daily, so you trade with the higher timeframe, not against it.

  • Reversal or continuation

    Separate signals tell a bounce from a genuine trend restart, so you always know which setup you're in.

Where it works

Markets it's built for

  • Forex Majors and gold, where momentum divergence is textbook.
  • Crypto BTC and liquid alts through fast momentum shifts.
  • Indices, stocks & commodities Any liquid symbol with a clean momentum read.

Each market routes to its own partner broker: support pairs the right one to the indicator you pick, so you're never sent to the wrong market.

Is it for you?

Who it's for, and what's inside

Best for

  • Divergence & momentum traders
  • Reversal traders
  • Multi-timeframe traders

Timeframes

Flexible: the dashboard tracks 5m, 15m, 1h, 4h and daily at once, from scalping to swing.

What's inside

  • Regular bull/bear divergence
  • Divergence quality grading
  • Dynamic price bands
  • 5-timeframe dashboard

No cost to you

How to get Xmaster Divergence free

  1. 1

    Tell support what you trade

    Message our 24/7 team with the indicator or market you want. They reply in your own language and pick the right broker partner for it.

  2. 2

    Open your partner account

    Register at that broker through our link and fund it: the broker pays us a partner commission, which is what lets us hand you the tools at no cost.

  3. 3

    Trade with it on TradingView

    Share your TradingView username and we add you. The scripts appear in your Favorites, ready on the chart you already use.

Good to know

Xmaster Divergence: your questions

Is it the same tool as on TradingView?

Yes, Xmaster Divergence is the exact invite-only script from our TradingFinder space, nothing watered down.

How much does it cost?

On TradingView the space lists at $48.88/mo. With SignalBots you get it two ways: a discounted subscription, or free once you trade as a VIP member through our broker partnership. Support sets up either route.

How do I get access?

Message our 24/7 support. They set up either route for you (a discounted subscription, or free VIP access once you trade with a partner broker) then add you on TradingView.

Which markets does it cover?

Forex, Crypto, Indices, stocks & commodities.

Which timeframes does it work on?

Flexible: the dashboard tracks 5m, 15m, 1h, 4h and daily at once, from scalping to swing.

Does it place trades for me?

No. It's a chart indicator that flags setups; every trade decision stays yours.

Do I need to install anything?

No. It runs inside the TradingView chart you already use, no install, no Pine editing.

Do I need a TradingView account?

A free TradingView account is enough. We add the script to your username.

Is performance guaranteed?

No. All results are historical and backtested, and trading carries risk. Read the Risk Warning first.

SignalBots Partner Program

They trade.
You earn: 40% for life.

Give your audience the free XHMaster & XMaster Formula Indicator. It flags every setup on their chart, they trade it, and you earn on every trade.

  • 40% lifetime
  • Paid monthly
  • No caps
Become a Partner 2-minute signup · keep your own brand
Estimate your commission Recurring
25 × X estimated recurring monthly commission

X = your commission from one baseline trader ($500 deposit, $50k monthly volume). Illustrative only: your real payout scales with the broker’s IB rate and your referrals’ actual trading.

SignalBots operates as an Introducing Broker and Master IB. Commission is paid on your referrals’ trading activity, not on recruitment. Trading carries substantial risk. See our Risk Warning.

Trade with Xmaster Divergence, free

Message support, open your partner account, and get added on TradingView, usually within minutes.

Indicators flag setups; they don't place trades. Past results are historical and backtested. Trading carries risk. Read the Risk Warning.