Free Futures Trading Signals

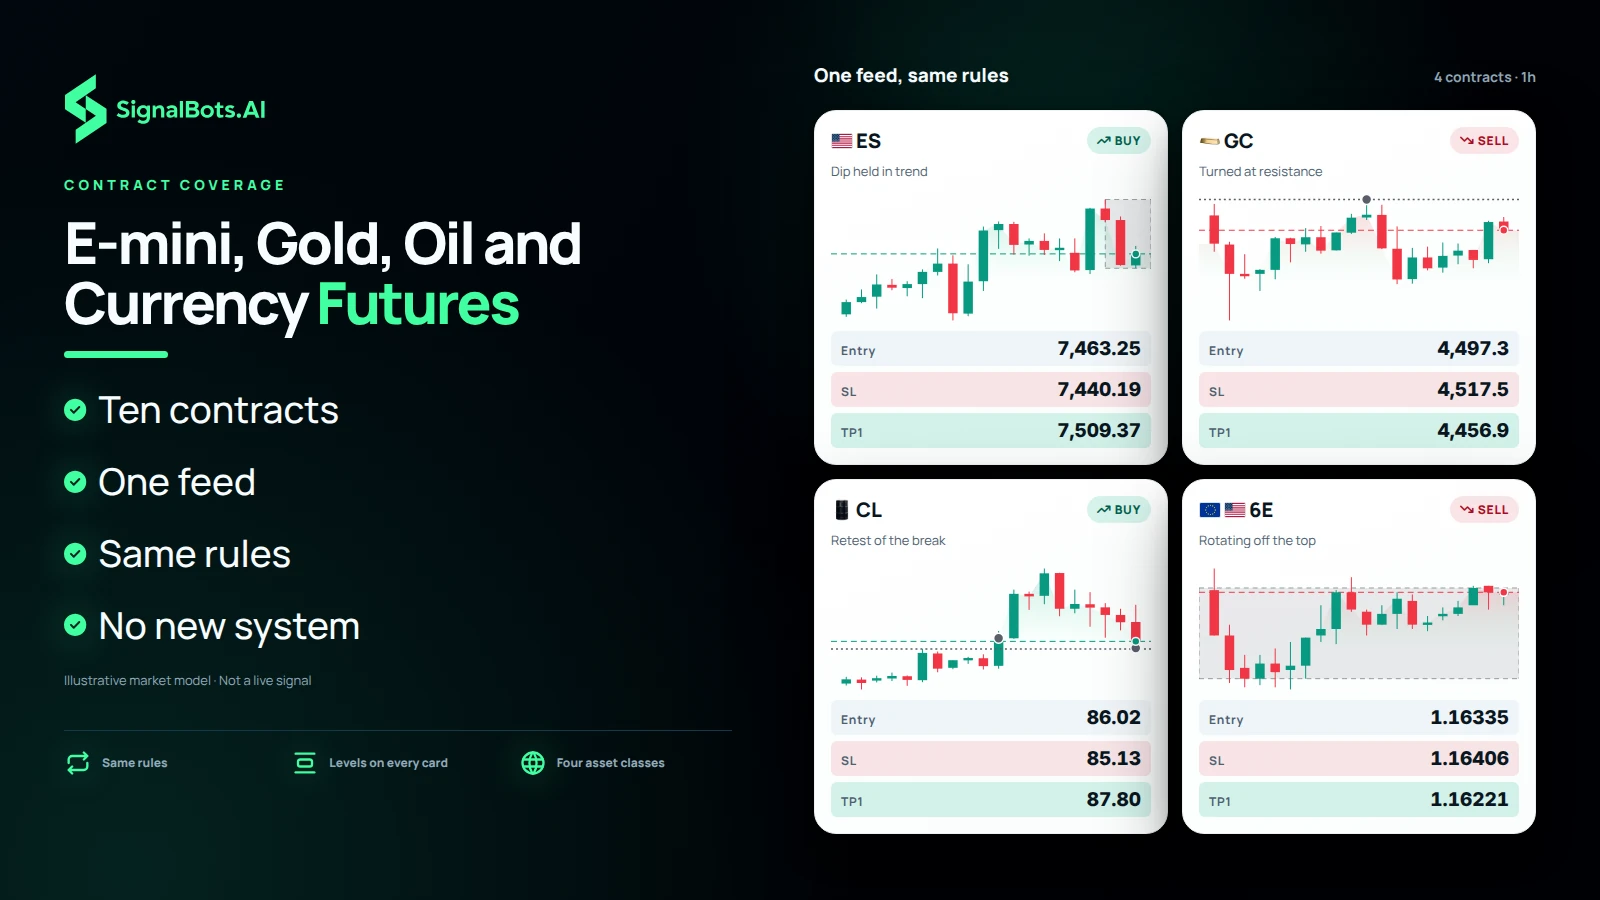
Live futures signals with tick-precise entries, stops and targets — trade the contracts to a defined plan with live status on every setup. Tap any contract for its full history.

Live Signals
LIVE 8 instruments Last signal 5 active now
Performance

Recent Results

Per-symbol net percentage outcome by day across the last 30 trading sessions. Filter to a symbol to isolate its track.

CL JUN26 1 Hour
Buy
Entry 91.45
Stop Loss 89.44
TP1 93.46
TP2 95.47
TP3 97.47
TP4 99.48
VIP Clients Only
Active #109092
NG1! 4 Hours
Buy
Entry 2.986
Stop Loss 2.904
TP1 3.068
TP2 3.151
TP3 3.233
TP4 3.316
Loss #104992
GC JUN26 30 Minutes
Buy
Entry 4526.20
Stop Loss 4500.67
TP1 4551.73
TP2 4577.25
TP3 4602.78
TP4 4628.30
VIP Clients Only
Active #109103
FDAX JUN26 1 Minute
Buy
Entry 26055.00
Stop Loss 26049.06
TP1 26060.94
TP2 26066.87
TP3 26072.81
TP4 26078.74
Loss #109138
ES JUN26 1 Minute
Buy
Entry 7755.00
Stop Loss 7753.66
TP1 7756.34
TP2 7757.68
TP3 7759.03
TP4 7760.37
Loss #109137
NQ JUN26 5 Minutes
Buy
Entry 29503.25
Stop Loss 29483.97
TP1 29522.53
TP2 29541.80
TP3 29561.08
TP4 29580.36
TP2 Hit #109126
6A JUN26 5 Minutes
Buy
Entry 0.7199
Stop Loss 0.7198
TP1 0.7200
TP2 0.7201
TP3 0.7202
TP4 0.7204
TP4 Hit #109127
YM JUN26 5 Minutes
Sell
Entry 53518.00
Stop Loss 53544.71
TP1 53491.29
TP2 53464.59
TP3 53437.88
TP4 53411.17
TP4 Hit #105746
Get every signal instantly Web, Telegram, browser extension, and mobile app — all included on any plan.
Monthly Summary Click to toggle
Month, Year Total Crude Oil (WTI) (CL JUN26) Natural Gas (NG) Gold (GC JUN26) DAX 40 (FDAX JUN26) S&P 500 (ES JUN26) Nasdaq 100 (NQ JUN26) Australian Dollar (6A JUN26) Dow Jones 30 (YM JUN26) British Pound (6B JUN26) Euro FX (6E JUN26)
Month-to-date 2,296,442 117,500 1,930 251,800 113,600 567,700 1,243,900 12 0 0 0
August 2026 47,475,867 634,700 5,610 15,708,700 17,618,700 4,171,300 9,387,500 157 -50,800 0 0
July 2026 94,646,050 779,800 11,350 11,157,500 11,068,500 2,221,400 62,128,700 0 7,278,800 0 0
June 2026 66,424,755 1,195,600 12,860 14,841,400 18,670,100 5,131,800 5,644,900 195 20,927,900 0 0
May 2026 46,104,921 906,400 12,890 17,674,200 14,289,600 4,084,600 6,115,000 31 3,022,200 0 0
April 2026 44,188,750 328,100 1,250 2,813,400 14,238,100 1,308,100 25,499,800 0 0 0 0
FAQs

Frequently Asked Questions

How fast do signals reach me?

Every signal pushes to you in under 10 milliseconds from when our engine fires — it lands on the web dashboard, Telegram, our browser extension, and the mobile app at the same time, so you never miss an entry.

What futures markets do you cover?

Every futures instrument with a live track record shows up as a card on this page, busiest first. Tap any card to open its full signal history.

What's inside each signal?

A clear direction (Buy or Sell), an entry price, a protective stop loss, and take-profit targets — plus a live status that updates as the trade plays out.

How should I size each trade?

We suggest risking 1–2% of your account per trade. Your position size then follows from the stop distance on each signal and the risk percentage you're comfortable with.

Where can I see past results?

Right on this page — the Recent Results chart and the full statistics panel above show every tracked outcome. We publish the complete record, wins and losses alike.

How will I receive signals?

Through whichever channels suit you — the web dashboard, Telegram, our browser extension, and the mobile app all stay in sync, so each signal reaches you wherever you are.

How do I get VIP access?

VIP access comes with every plan — message our team and we'll set you up.

Do you guarantee profits?

No — and be wary of anyone who does. Futures trading carries substantial risk. Read our Risk Warning and judge the historical edge for yourself before subscribing.

Can I cancel any time?

Yes. Cancel in one click from your dashboard — no hidden fees and no auto-renewal traps.

Still have questions?

Our team is happy to help before you join — get in touch and we'll walk you through anything you're unsure about.

Win Rate

Wins vs losses
73%
Win Rate

Gain Chart

Cumulative growth over the last 120 days
Past performance is not indicative of future results. Futures trading carries substantial risk — review our Risk Warning before subscribing.
ROI Calculator

What if you traded with us?

Move the slider — see the cumulative return our tracked signals produced over the last 7 days, applied to your starting capital.

Starting $1,000
After last 7 days $1,760 +$760
Hypothetical, based on historical Win Rate. Not a guarantee of future returns.
+6789.79%
Total Gain
22.96%
Max Drawdown
+$523061.69
Net Profit
Full Advanced Statistics Click to expand

Advanced Statistics

Updated Sep 4, 2026 · 01:53 GMT
Balance $533061.69
Equity (100.00%) $533061.69
Floating PL $0.0
Deposits $10000.0
Withdrawals $0
Trades 673
Pips 52306169
Won 73%
Avg. Trade Time
Lots 87.49
Profit Factor 4.35
Daily 35.34%
Monthly 1060.26%
Trades Per Month 136
Expectancy 390705.1 Pips / $3907.05

Ready to trade futures with us?

Full access to every signal across 8 instruments, with instant alerts on the web, Telegram, our extension and mobile app.

No card needed
Add SignalBots as a preferred source on Google Add SignalBots as a preferred source on Google