Crypto Futures

Crypto Liquidation Price Calculator

See where an isolated-margin futures position gets liquidated before you open it. Set your entry, leverage, and side to know exactly how much room your trade has.

50,000

The price at which you enter the position.

Long

Long profits when price rises; short when it falls.

10x

Higher leverage moves the liquidation price closer to your entry.

0.50%

The minimum margin the exchange requires to keep the position open.

Estimated Liquidation Price $45,250.00

Your long would be liquidated if price falls about 9.50% from entry.

Distance to Liquidation9.50%
Price Move That Liquidates$4,750.00

For educational purposes only. Read our risk warning before trading.

The Math

How Liquidation Price Is Estimated

For an isolated-margin position (ignoring fees and funding), the liquidation price is your entry adjusted by the inverse of your leverage, softened by the maintenance margin the exchange keeps in reserve. More leverage means a smaller buffer before liquidation.

Quick Reference

Liquidation Distance by Leverage

LeverageLong Liq DistanceShort Liq Distance
2x49.50%49.50%
5x19.50%19.50%
10x9.50%9.50%
20x4.50%4.50%
50x1.50%1.50%
100x0.50%0.50%

Distances assume a 0.5% maintenance margin rate. Your exchange's tiered margin schedule and fees will shift the exact level.

Frequently Asked Questions

Why does more leverage liquidate sooner?

Higher leverage means you post less margin per dollar of exposure, so a smaller adverse price move wipes out that margin. At 100x a 0.5% move can liquidate you; at 5x it takes roughly 19.5%.

What is the maintenance margin rate?

It is the minimum equity the exchange requires to keep a position open, usually 0.5% and rising on larger positions. The closer your equity gets to it, the closer you are to liquidation.

Is this the exact liquidation price?

It is a close approximation for isolated margin. Trading fees, funding payments, and tiered maintenance margins shift the real level, so treat the result as a planning estimate rather than a guarantee.

Does cross margin change the result?

Yes. This tool assumes isolated margin, where only the position's own margin backs it. Cross margin shares your whole wallet balance, which usually pushes liquidation further away.

Futures danger zone

Liquidation Price Calculator for Isolated Margin Futures

This liquidation price calculator shows where an isolated-margin futures position gets liquidated before you open it. Enter your entry price, pick long or short and set the leverage, and the result marks the room your trade has between entry and the level where the exchange closes it, the danger zone to plan around. The default example is a $50,000 entry at 10x, which leaves about 9.5% of room at a 0.5% maintenance margin rate. It is free, browser-based and runs only on the numbers you type, and since leveraged futures carry risk of loss, treat the output as a planning estimate.
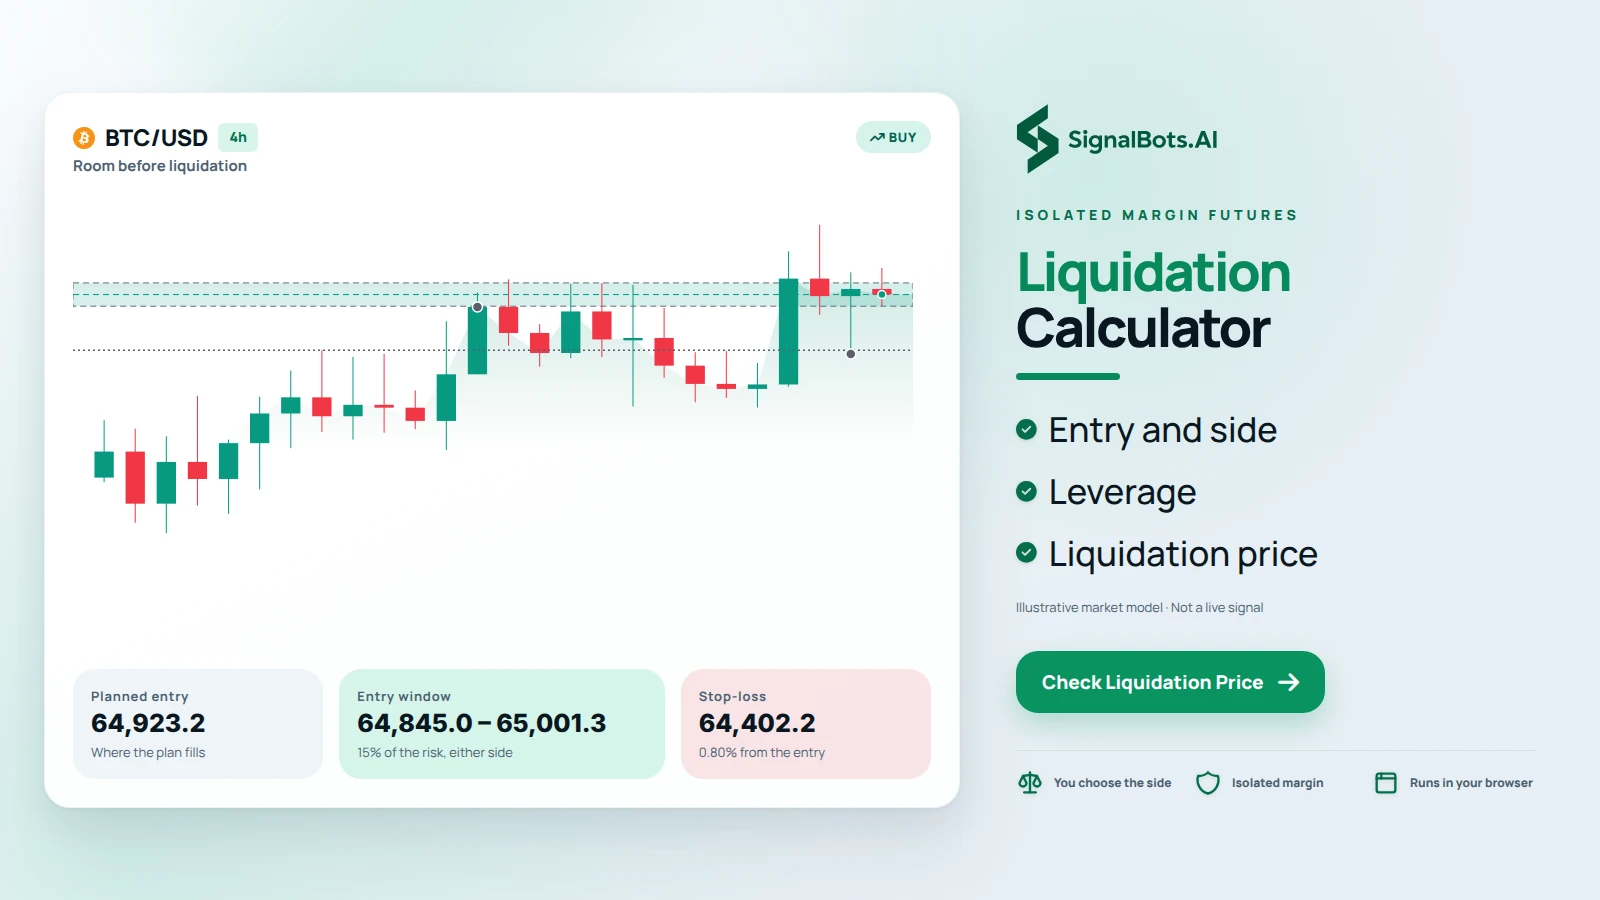
BTC/USD 4h chart with the entry window shaded between the planned entry and the stop-loss, cards below showing planned entry 64,923.2, entry window 64,845.0-65,001.3 and stop-loss 64,402.2
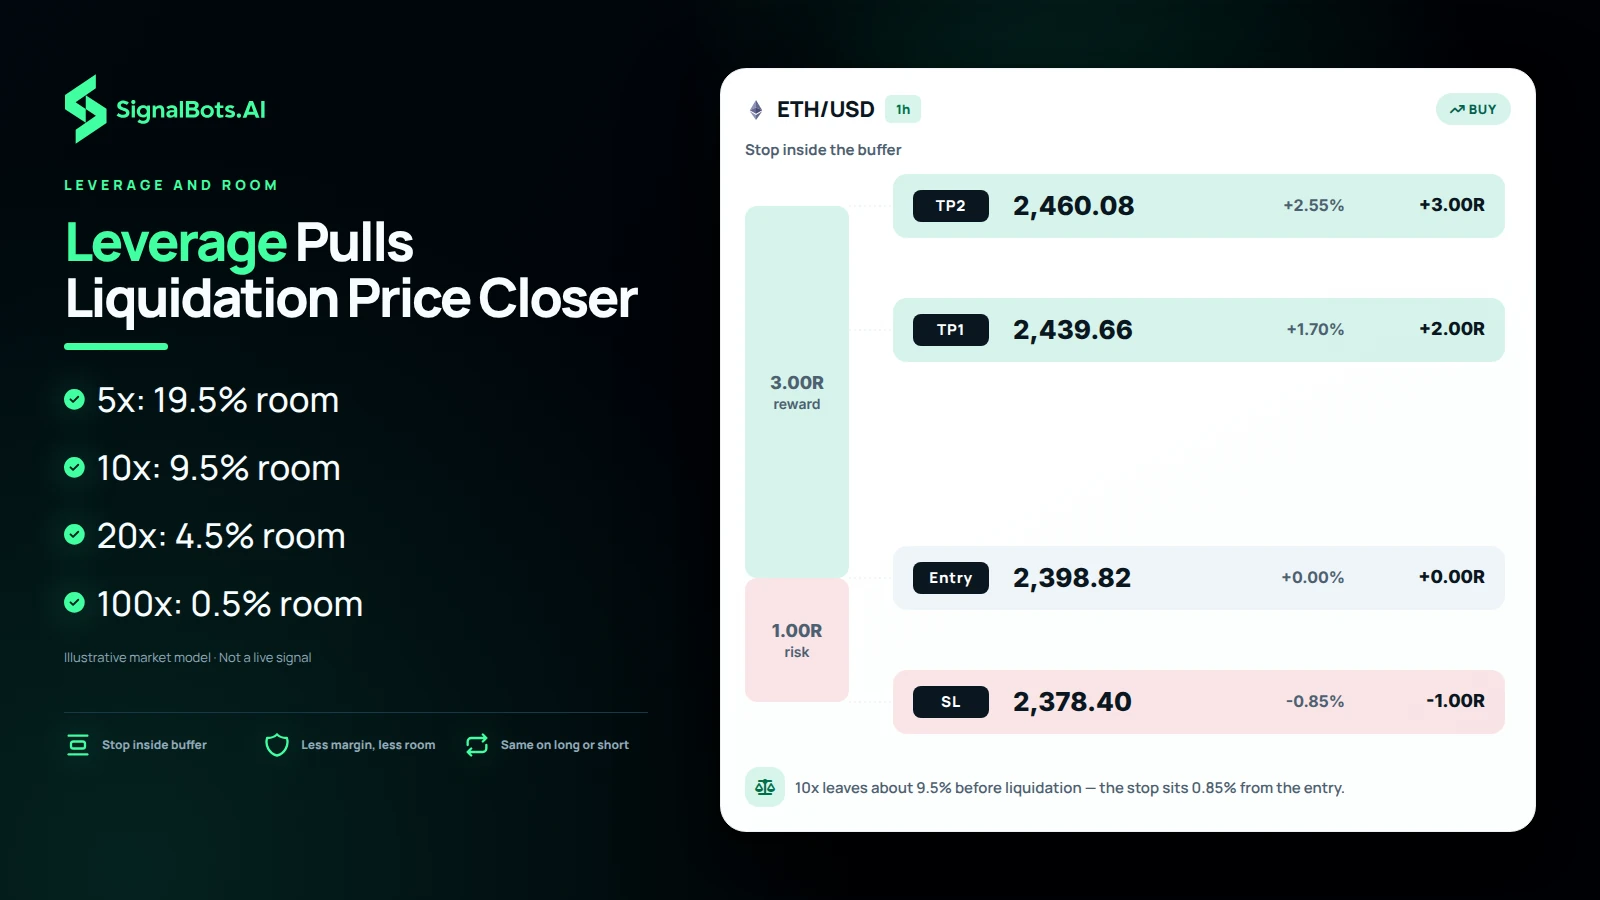
ETH/USD 1h risk ladder showing entry, stop-loss and two take-profit rungs at true scale with a 3.00R reward band above a 1.00R risk band

Leverage and room

How Leverage Pulls Your Crypto Liquidation Price Closer

Higher leverage means you post less margin per dollar of exposure, so a smaller adverse move wipes that margin out. At a 0.5% maintenance margin rate the liquidation distance is about 49.5% at 2x, 19.5% at 5x, 9.5% at 10x, 4.5% at 20x, 1.5% at 50x and only 0.5% at 100x, the same for a long or a short. That comes from Long Liq = Entry × (1 - 1/Leverage + MMR), mirrored for a short. If your stop-loss sits further away than that distance, liquidation can close the trade before the stop is reached, and leveraged trading carries risk of loss.

Margin mode

Isolated vs Cross Margin Liquidation on Crypto Futures

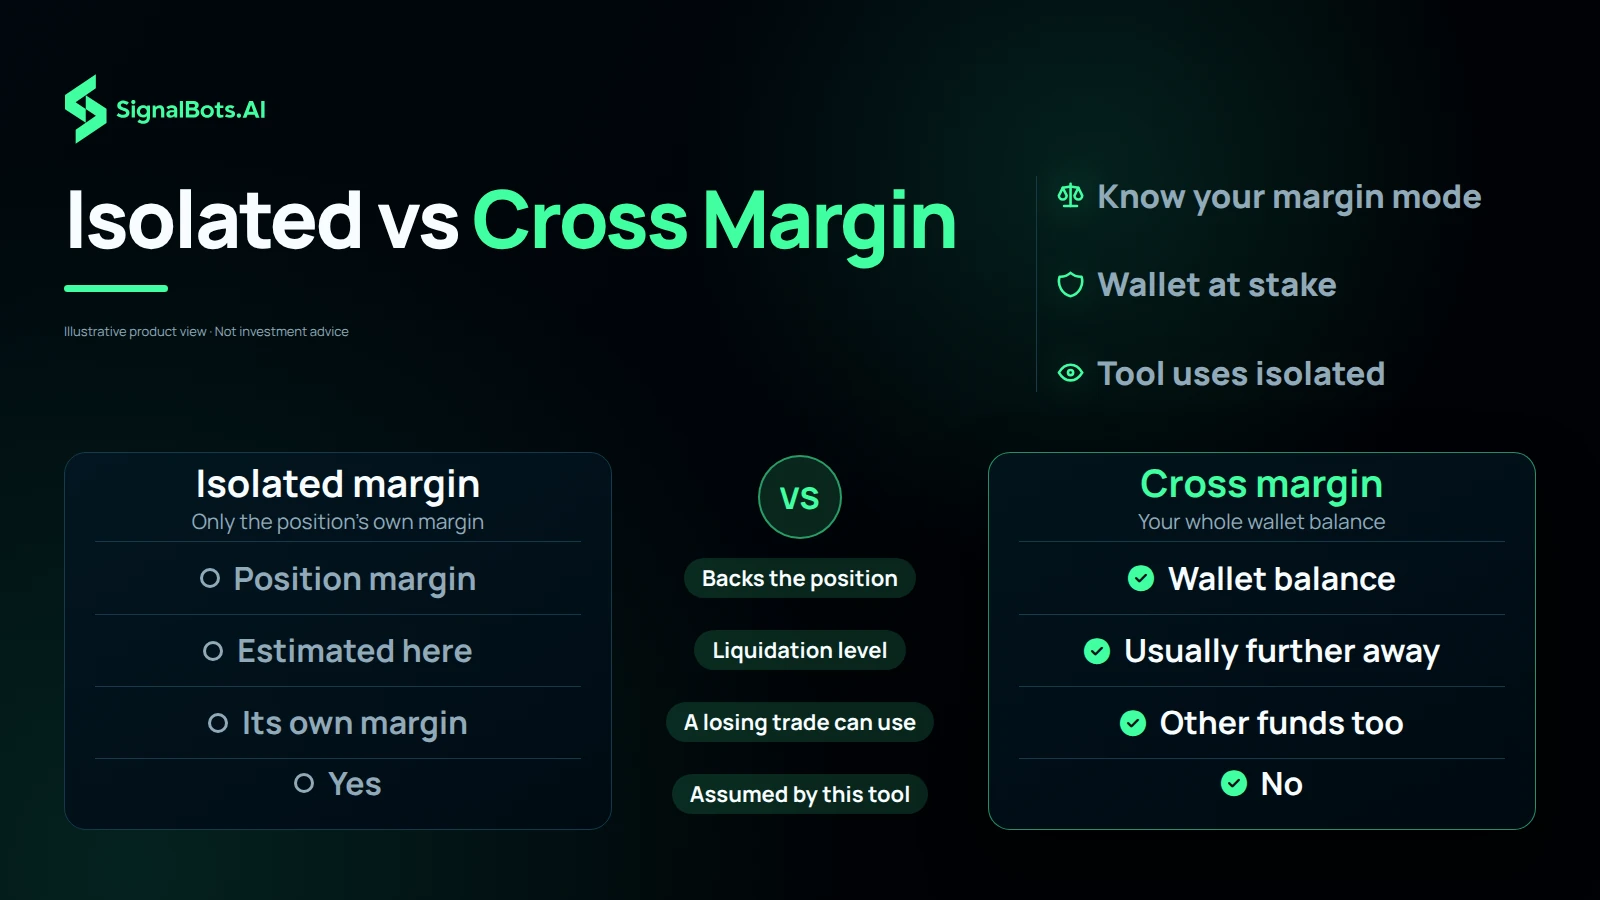
This calculator assumes isolated margin, where only the margin you assign to one position backs it and a liquidation costs that position's margin alone. Cross margin shares your whole wallet balance across open positions, which usually pushes the liquidation level further away because more funds stand behind the trade. The trade-off is that a losing cross-margin position can draw on money you meant for other trades. If you trade cross, the level shown here will usually sit nearer to your entry than your real one, so read it as the tighter case, and remember that leveraged futures carry risk of loss in either mode.

Two-column comparison of isolated margin versus cross margin across what backs the position, where liquidation tends to sit, what a losing trade can draw on, and which mode the tool assumes
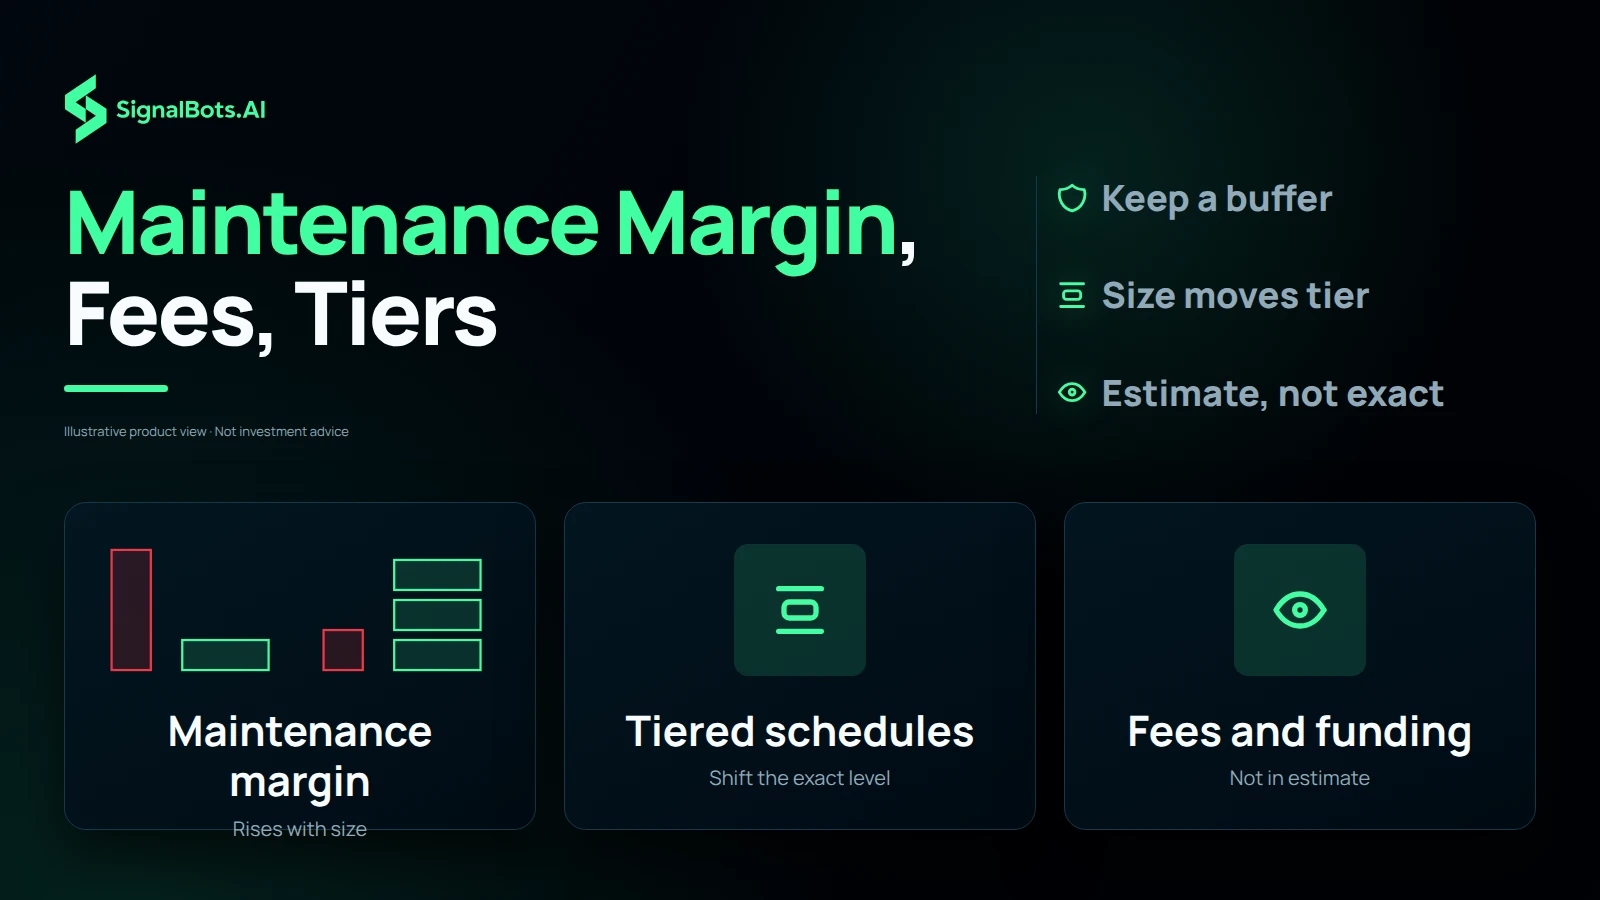
Three tiles: maintenance margin rate that rises with position size, tiered margin schedules that shift the exact liquidation level, and fees and funding not included in the estimate

Not in the estimate

Maintenance Margin Rate, Fees and Tiers That Shift Liquidation

The estimate uses one maintenance margin rate, the minimum equity an exchange requires to keep a position open, which is usually 0.5% and rises on larger positions. Exchanges apply it through a tiered margin schedule, so a big position can land in a higher tier and be liquidated sooner than the distance table suggests. Trading fees and funding payments on perpetual contracts can also eat into your margin while the trade is open. None of these is in the result, so read it as a close approximation for isolated margin, keep a buffer beyond it, and remember leveraged trading carries risk of loss.

Stop first, then leverage

Crypto Futures Liquidation Price Check Before You Pick Leverage

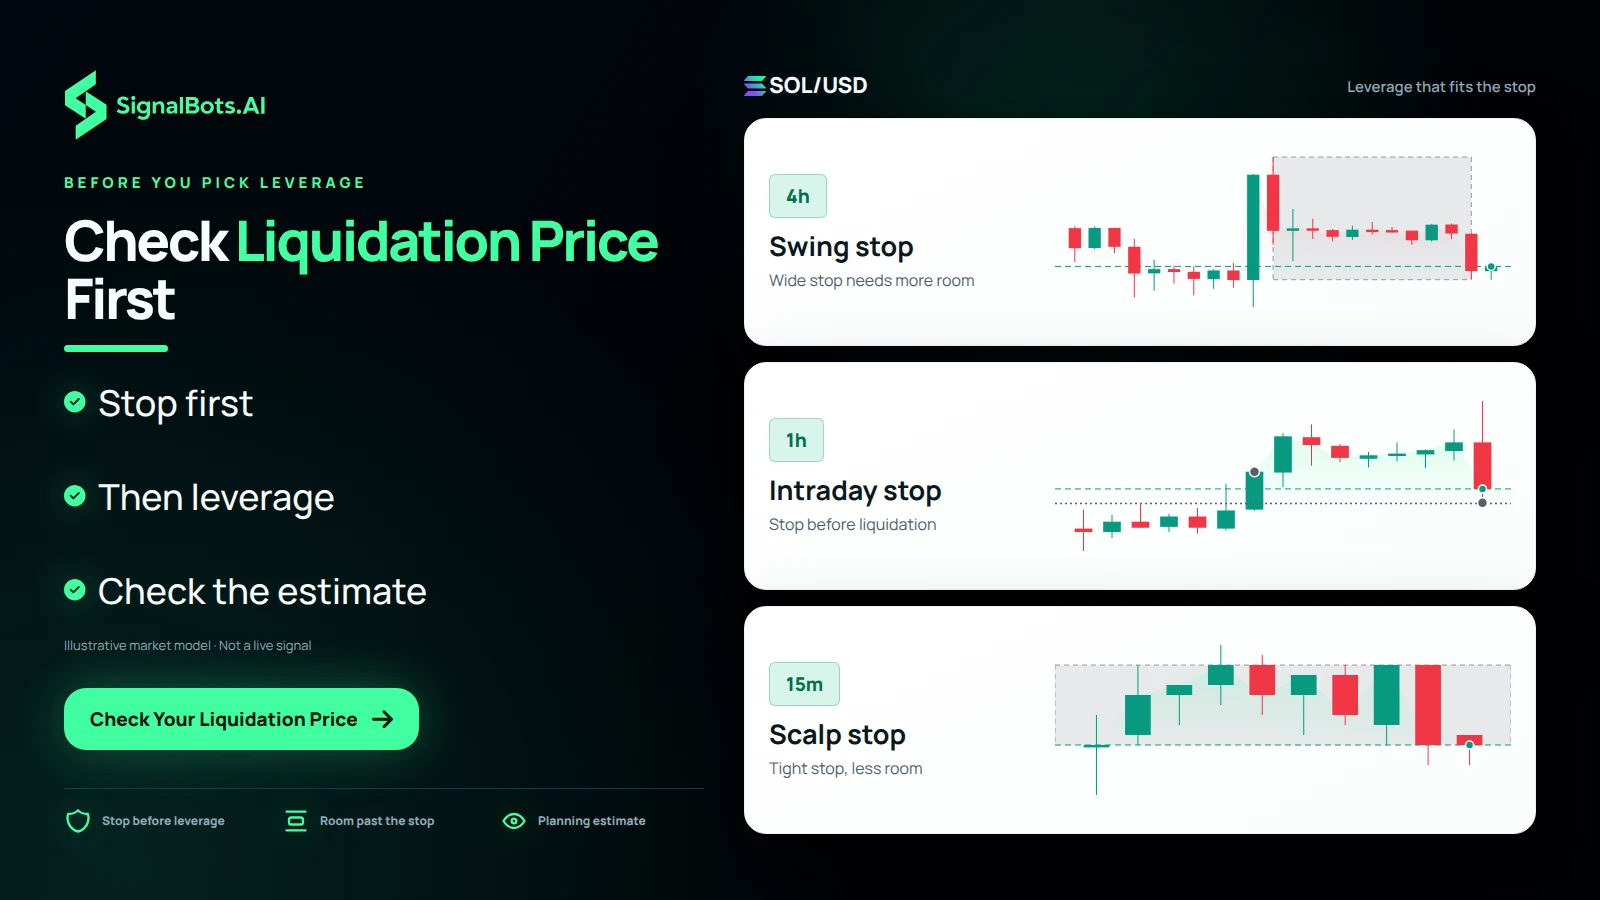
Set your stop-loss from the chart first and choose leverage second, never the other way round. A swing trade on the 4h often needs a wide stop, and at 20x only about 4.5% separates entry from liquidation, which can arrive before that stop does; a scalp on the 15m with a tight stop fits a smaller distance. Run your entry, side and leverage through the calculator and confirm the liquidation level sits well beyond the stop, with room left for fees, funding and your exchange's tiers. If it does not, lower the leverage, because leveraged futures carry risk of loss.

SOL/USD shown on three timeframe rungs, 4h swing stop, 1h intraday stop and 15m scalp stop, each with a stop of different width relative to the liquidation room it needs
Built for your broker

Keep your broker. Keep your edge.

No switching accounts, no relearning a platform. Whichever Crypto broker you already trust, SignalBots plugs straight in with extensions, robots, connectors and live signals tuned to it.