Multi-asset · VIP access

ICT AI ATR Signals

Entries that adapt to the market's pace

One moving average for trend, ATR bands for live volatility, so the signal tightens and widens with the market instead of using a single fixed setting that fits nothing.

View on TradingView

775 community boosts · $48.88/mo on TradingView, free or discounted for SignalBots members.

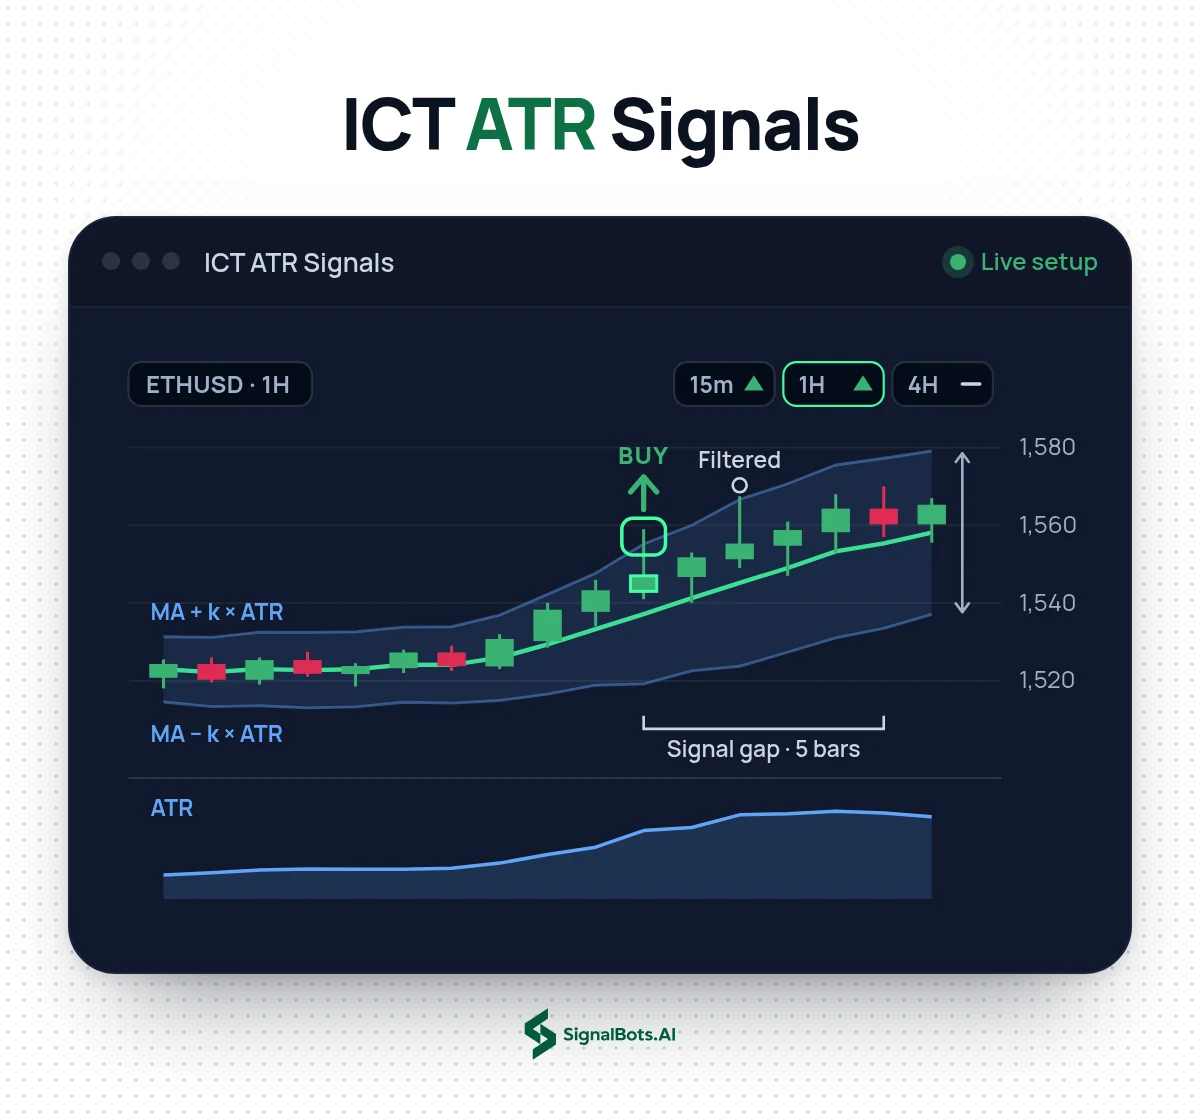
ICT AI ATR Signals on an ETHUSD 1H chart: ATR bands around a moving average tighten in a quiet market and widen as ATR rises, a candle pierces the upper band and closes back inside for a buy signal, and a second pierce within the signal gap is filtered out.
Step-by-Step Setup

Unlock ICT ATR Signals free in 3 steps

Follow the steps in order. Open an eligible partner account the right way, get your free VIP license, then learn how to read and trade the indicator on TradingView.

Step 1 of 3

Exness Sign Up

Which describes you?

Already on Exness? Move your account

Already have a Exness account? Move it under our partner link in a few steps so it qualifies for free VIP access to ICT ATR Signals: the guide shows the safe way.

What it does

ATR Indicator That Tightens and Widens With Live Volatility

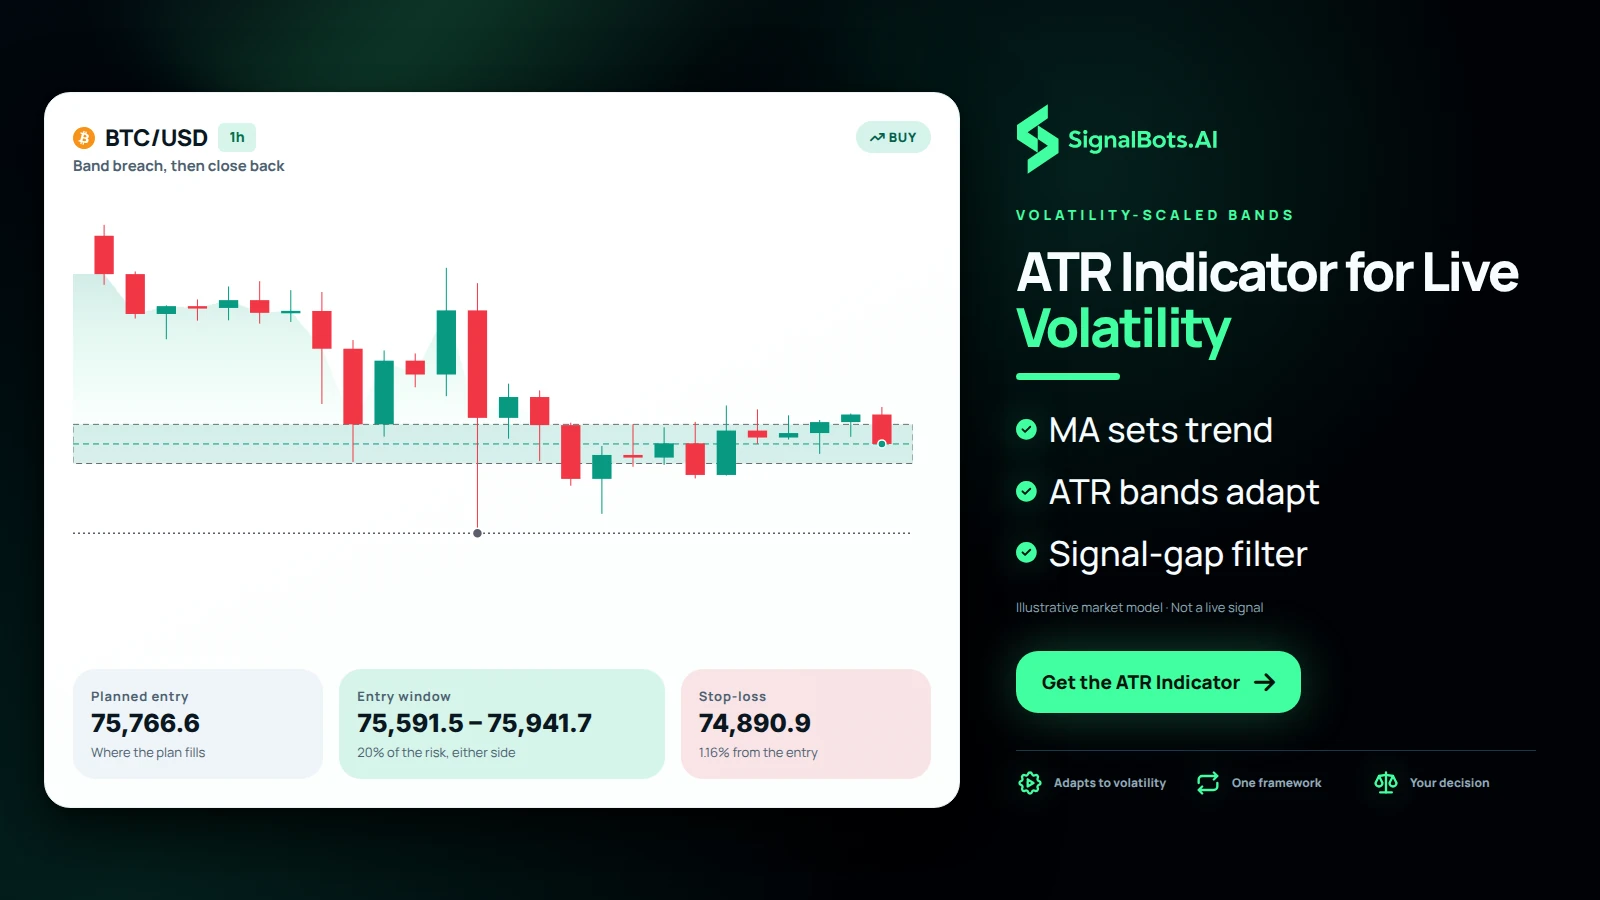
ICT AI ATR Signals is an ATR indicator that reads trend from one central moving average and sizes bands above and below it to current volatility. When the market speeds up, the bands widen; when it goes quiet, they tighten. That keeps entries relevant as conditions change. On the chart, it watches for price breaching a band, then closing back, and a signal-gap filter is part of the same framework. The invite-only script sits on your TradingView chart and flags setups, while every trade stays your decision.

Show one BTCUSD 1h chart with a central moving average and ATR bands above and below it, price breaching the lower band and closing back, and the entry band marked beside a coin object.
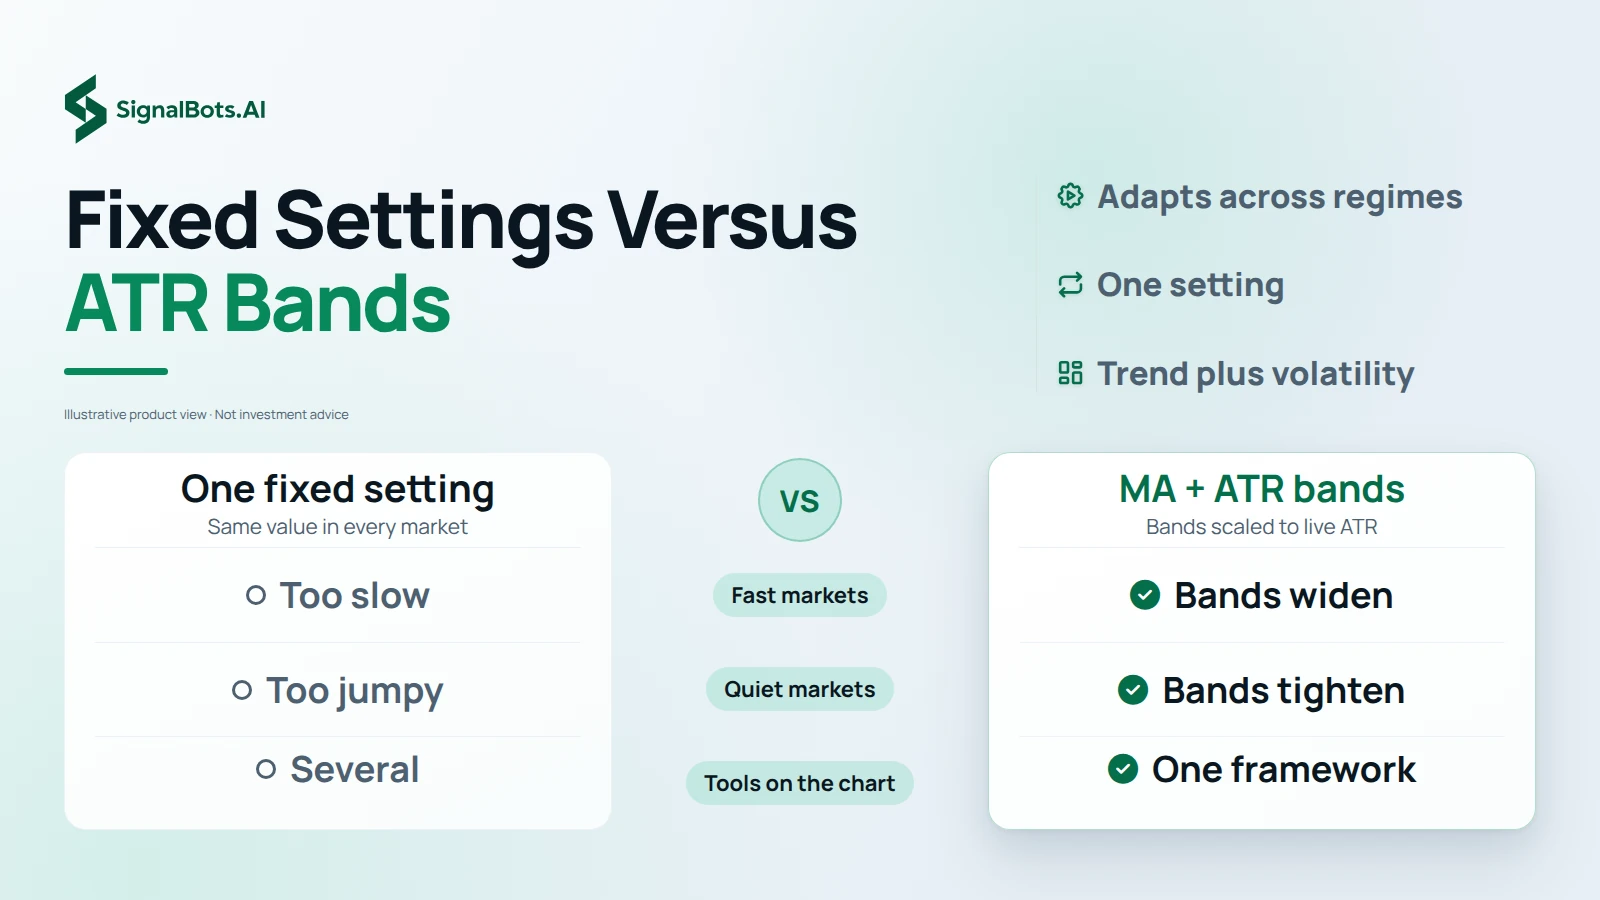
Contrast one fixed setting with MA plus ATR bands in three rows: how each behaves in fast markets, in quiet markets, and how many tools the chart needs.

Fixed versus adaptive

Fixed Indicator Settings Versus Bands Scaled to ATR Volatility

Most indicators rely on fixed indicator settings, and one static value is too slow in fast markets and too jumpy in quiet ones. Scaling the bands to ATR volatility answers that mismatch. Average true range measures how far price typically travels over recent candles, so bands built on it widen when that range expands and tighten when it contracts, and the same setting keeps working across regimes. You also get trend, volatility, key levels and signals in one framework, rather than stacking five separate tools on the chart to cover the same ground.

What's inside

EMA, SMA, RMA, WMA or HMA Behind One Volatility Framework

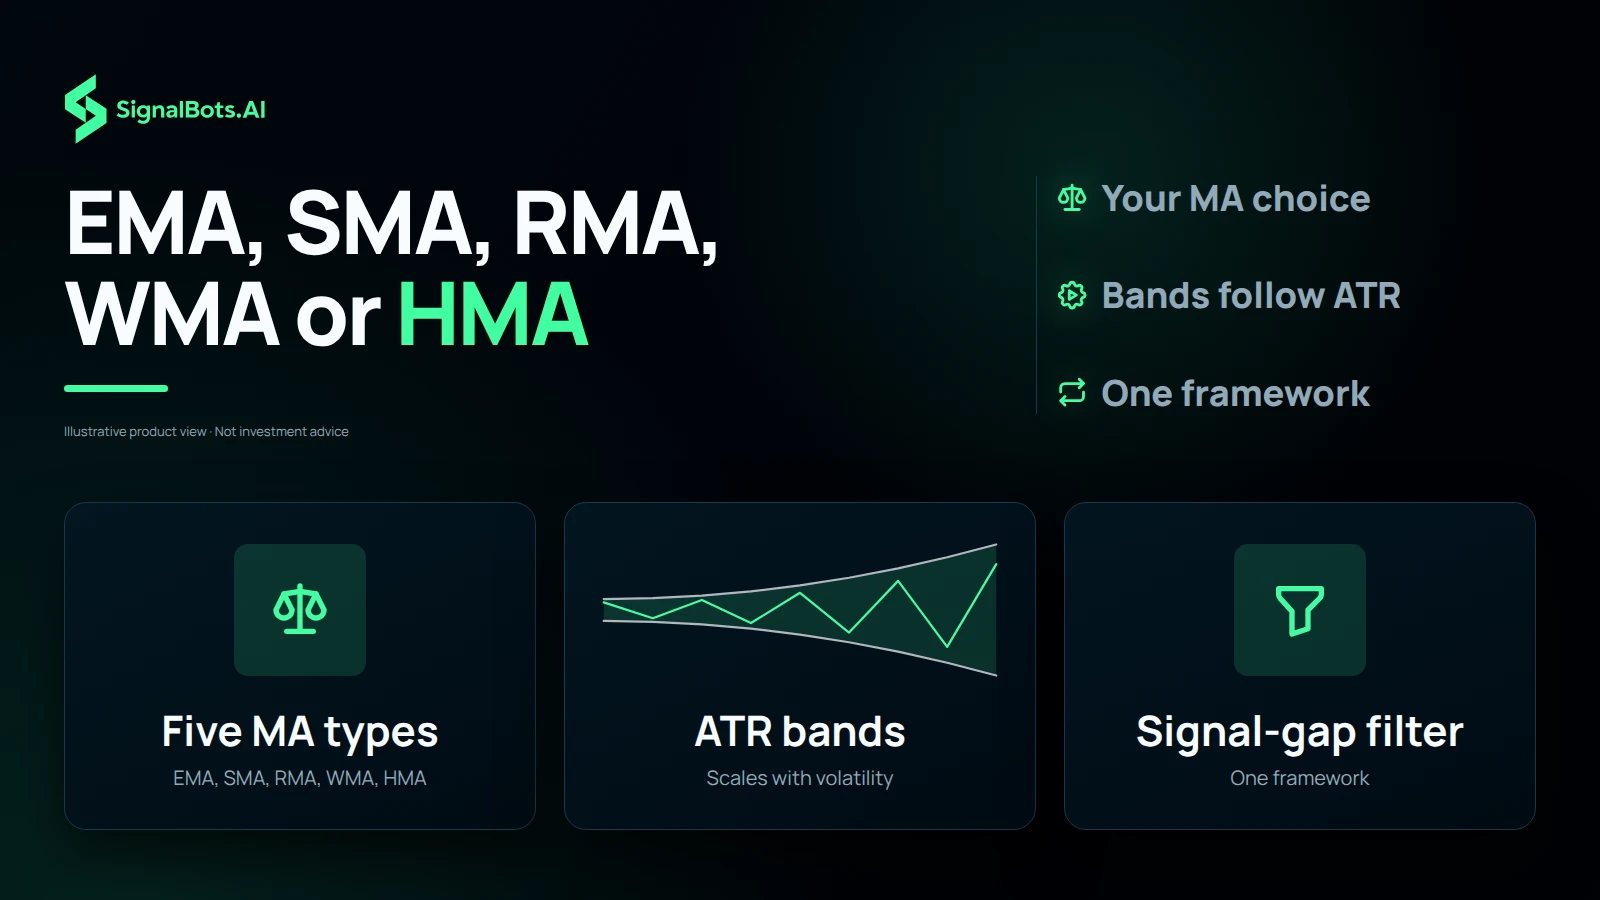
The trend line at the center does not have to be one type of moving average. You choose an EMA, SMA, RMA, WMA or HMA, and the ATR bands above and below it stay scaled to current volatility whichever you pick. Each average weights recent prices differently: an EMA or HMA reacts faster to new candles, while an SMA treats every bar in its lookback evenly, so your choice shapes how quickly the trend read turns. A signal-gap filter sits in the same framework, alongside a multi-symbol dashboard for watching more than one chart.

Show three tiles: five MA types listed as EMA, SMA, RMA, WMA or HMA; ATR bands scaled to live volatility; and the signal-gap filter built into the framework.
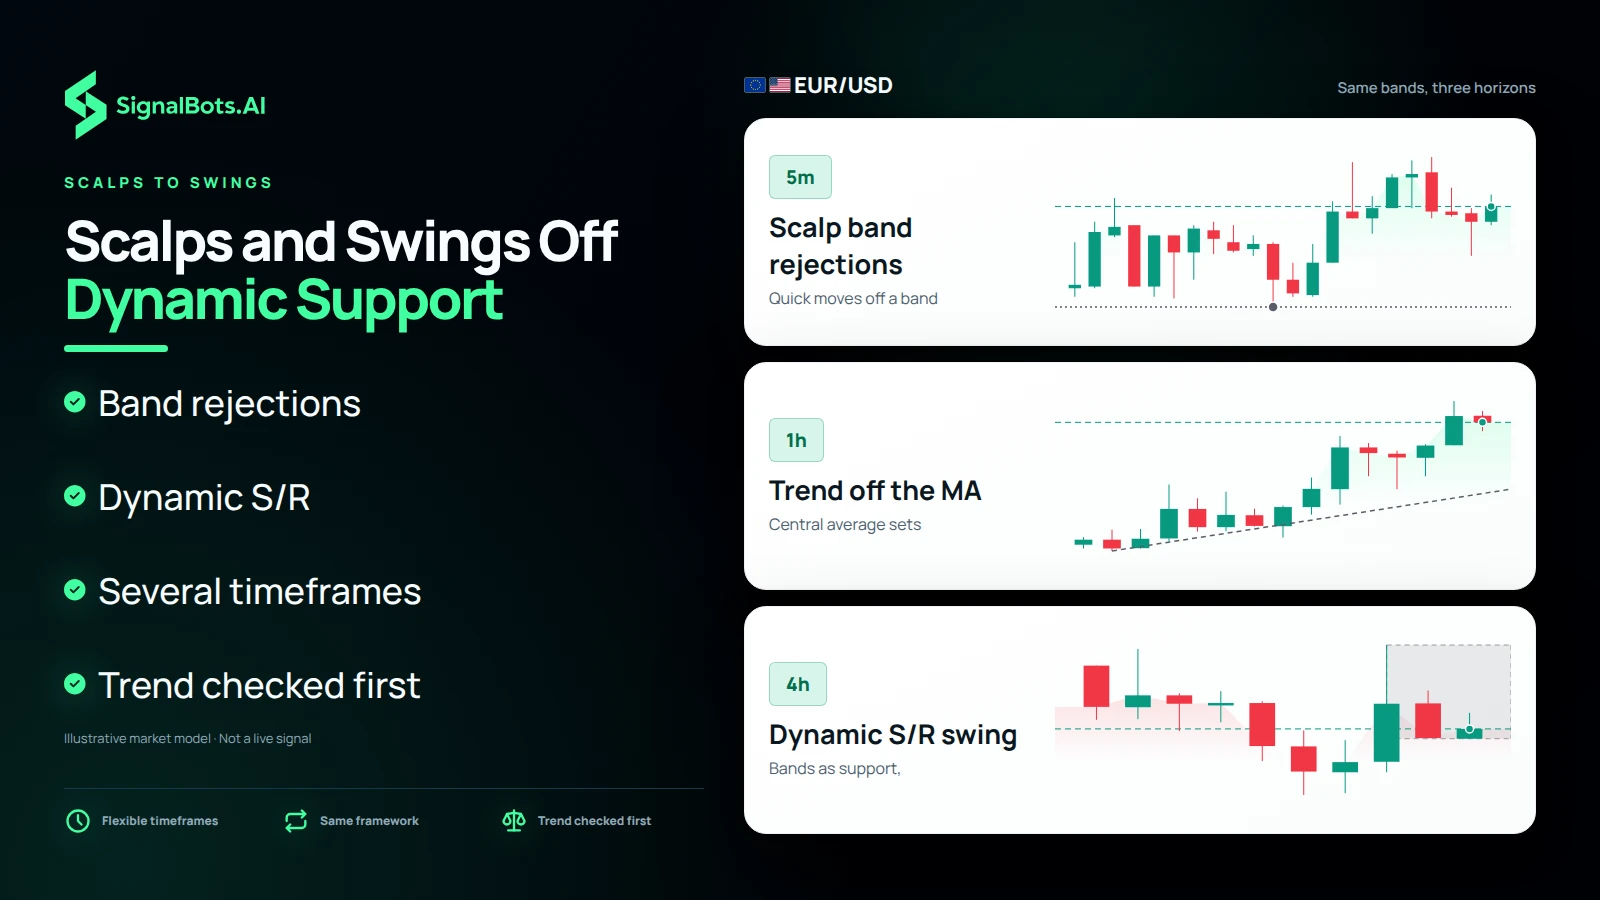
Show EURUSD on three rungs: a 5m band rejection for a quick scalp, a 1h trend read off the moving average, and a 4h swing using the bands as dynamic support.

Scalps to swings

Quick Scalps and Swing Trades Off the Same Dynamic Support

The timeframe is flexible, and the same bands serve two very different jobs. On a fast chart, quick scalps come from band rejections, where price pushes into an ATR band and fails to hold beyond it. On slower charts, swing traders can treat the moving average and its bands as dynamic support and resistance that shift with volatility, rather than lines drawn once and left to go stale. Because the dashboard can watch several timeframes at once, you can check the slower chart's trend before acting on a faster rejection.

Who it suits

Multi-Symbol ATR Dashboard for Forex, Crypto and Index Traders

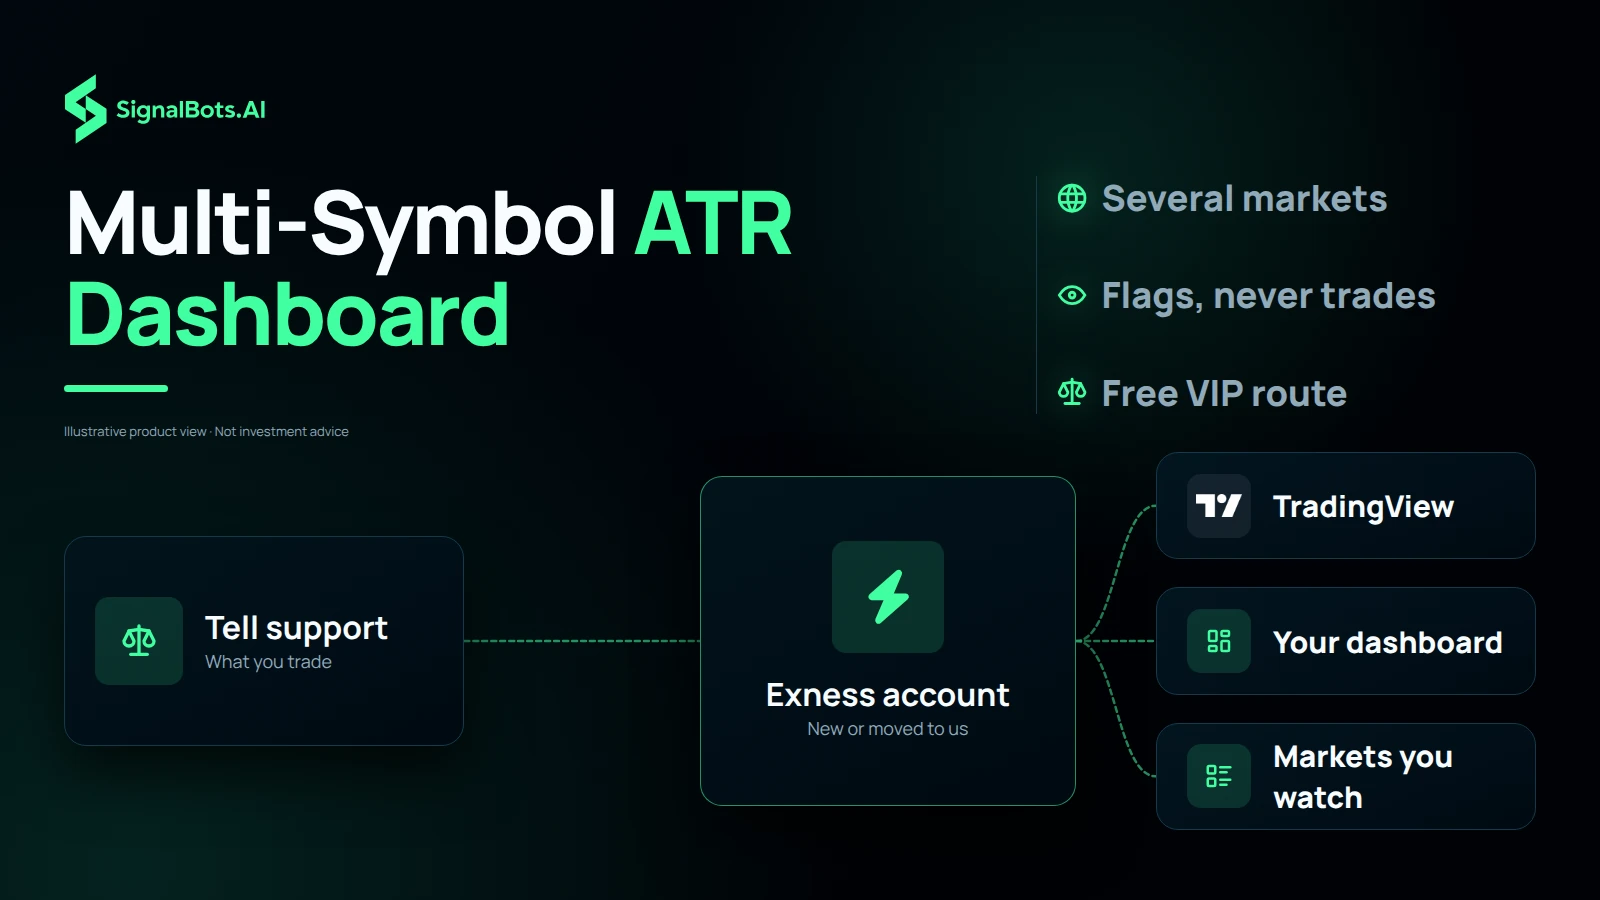
The multi-symbol dashboard suits trend and momentum traders, scalpers and swing traders who follow more than one market: EURUSD and the majors through trending and ranging phases, BTC and alts where volatility shifts fast, and index and equity charts. The script carries 775 community boosts on TradingView. To start, tell support what you trade, then open an Exness account through our partner link, or move an existing one under it, for free VIP access, and share your TradingView username. It flags setups and never trades for you, and trading carries risk of loss.

A route from telling support what you trade, through an Exness partner account opened or moved under our link, out to the TradingView username, the dashboard and the markets it watches.

On the chart

ICT ATR Signals in action

Live chart from ICT ATR Signals on TradingView.

How it works

What ICT ATR Signals does

Most indicators use one static setting that's too slow in fast markets and too jumpy in quiet ones. This one reads trend from a moving average and sizes its bands to live ATR volatility, so entries stay relevant as conditions change.

  1. 1

    A central moving average sets the trend direction.

  2. 2

    ATR-based bands sit above and below it, scaled to current volatility.

  3. 3

    Price breaching a band then closing back inside flags exhaustion: your signal.

Why traders use it

What you get out of it

  • One tool, not five

    Trend, volatility, key levels and signals live in a single framework.

  • Adapts in real time

    Bands breathe with volatility, so the same setting works across regimes.

  • Short- and long-term

    Quick scalps off band rejections, or dynamic support/resistance for swings.

Where it works

Markets it's built for

  • Forex EURUSD and majors across trending and ranging phases.
  • Crypto BTC and alts where volatility shifts fast.
  • Indices & stocks Dynamic support/resistance on index and equity charts.

Each market routes to its own partner broker: support pairs the right one to the indicator you pick, so you're never sent to the wrong market.

Is it for you?

Who it's for, and what's inside

Best for

  • Trend & momentum traders
  • Scalpers wanting quick moves
  • Swing traders using dynamic S/R

Timeframes

Flexible: the dashboard can watch several timeframes at once.

What's inside

  • MA + ATR bands
  • EMA/SMA/RMA/WMA/HMA options
  • Multi-symbol dashboard
  • Signal-gap filter

No cost to you

How to get ICT ATR Signals free

  1. 1

    Tell support what you trade

    Message our 24/7 team with the indicator or market you want. They reply in your own language and pick the right broker partner for it.

  2. 2

    Open your partner account

    Register at that broker through our link and fund it: the broker pays us a partner commission, which is what lets us hand you the tools at no cost.

  3. 3

    Trade with it on TradingView

    Share your TradingView username and we add you. The scripts appear in your Favorites, ready on the chart you already use.

Good to know

ICT ATR Signals: your questions

Is it the same tool as on TradingView?

Yes, ICT ATR Signals is the exact invite-only script from our TradingFinder space, nothing watered down.

How much does it cost?

On TradingView the space lists at $48.88/mo. With SignalBots you get it two ways: a discounted subscription, or free once you trade as a VIP member through our broker partnership. Support sets up either route.

How do I get access?

Message our 24/7 support. They set up either route for you (a discounted subscription, or free VIP access once you trade with a partner broker) then add you on TradingView.

Which markets does it cover?

Forex, Crypto, Indices & stocks.

Which timeframes does it work on?

Flexible: the dashboard can watch several timeframes at once.

Does it place trades for me?

No. It's a chart indicator that flags setups; every trade decision stays yours.

Do I need to install anything?

No. It runs inside the TradingView chart you already use, no install, no Pine editing.

Do I need a TradingView account?

A free TradingView account is enough. We add the script to your username.

Is performance guaranteed?

No. All results are historical and backtested, and trading carries risk. Read the Risk Warning first.

SignalBots Partner Program

They trade.
You earn: 40% for life.

Give your audience the free ICT AI ATR Signals. It flags every setup on their chart, they trade it, and you earn on every trade.

  • 40% lifetime
  • Paid monthly
  • No caps
Become a Partner 2-minute signup · keep your own brand
Estimate your commission Recurring
25 × X estimated recurring monthly commission

X = your commission from one baseline trader ($500 deposit, $50k monthly volume). Illustrative only: your real payout scales with the broker’s IB rate and your referrals’ actual trading.

SignalBots operates as an Introducing Broker and Master IB. Commission is paid on your referrals’ trading activity, not on recruitment. Trading carries substantial risk. See our Risk Warning.

Trade with ICT ATR Signals, free

Message support, open your partner account, and get added on TradingView, usually within minutes.

Indicators flag setups; they don't place trades. Past results are historical and backtested. Trading carries risk. Read the Risk Warning.