Trading Risk Tool

Risk/Reward Ratio Calculator

Enter your entry, stop-loss, and take-profit prices to see your reward-to-risk ratio and the win rate you need just to break even. Works for forex, crypto, stocks, and any other market.

100

The price you plan to open the trade at.

95

Where you exit if the trade goes against you.

110

Where you take profit if the trade works out.

Reward : Risk 2.00 : 1

Risking 5.0000 to make 10.0000. You need to win just 33.3% of trades to break even at this ratio.

Risk (per unit)5.0000
Reward (per unit)10.0000
Break-even win rate33.3%

For educational purposes only. Read our risk warning before trading.

The Math

How the Reward-to-Risk Ratio Is Calculated

Your risk is the price distance from entry to stop-loss; your reward is the distance from entry to take-profit. Divide reward by risk to get the ratio. From that ratio you can read the break-even win rate — the share of trades you must win for wins and losses to cancel out.

Quick Reference

Break-even win rate by ratio

Reward : RiskBreak-even win rate
1 : 150%
1.5 : 140%
2 : 133.3%
3 : 125%
4 : 120%

Frequently Asked Questions

What is a good risk/reward ratio?

Many traders look for at least 2:1, meaning they aim to make twice what they risk. A higher ratio lowers the win rate you need to break even, but it usually means a more distant target that price reaches less often. The right balance depends on your strategy's actual hit rate.

How does R:R relate to win rate?

They trade off against each other. At 1:1 you must win half your trades to break even; at 2:1 you only need about a third; at 3:1 just a quarter. The calculator shows the exact break-even win rate so you can check whether your strategy realistically clears that bar.

Does high R:R guarantee profit?

No. A high ratio only lowers the win rate you need to break even — it says nothing about how often price actually hits your target. Distant targets are reached less frequently, so a tempting 5:1 setup can still lose money if your real win rate falls below its break-even point. Always pair the ratio with a realistic hit rate.

Does this work for any market?

Yes. The ratio is based purely on the price distances between your entry, stop, and target, so it applies to forex, crypto, stocks, indices, and futures alike. Enter prices in whatever units your market quotes — dollars, points, or pips — and the ratio and break-even win rate stay valid.

Ratio calculator

Risk Reward Ratio Calculator for Entry, Stop-Loss and Target

Type in your entry price, the stop-loss price where you exit if the trade goes against you, and your take-profit price, and the risk reward ratio calculator hands back two numbers: your reward-to-risk ratio and the break-even win rate, the share of trades you must win for wins and losses to cancel out. It works for forex, crypto, stocks and any other market, costs nothing and runs in the browser, so you get a figure to size, skip or re-plan a setup before any money is committed. Read the ratio as a planning check rather than a forecast, because trading carries risk of loss.
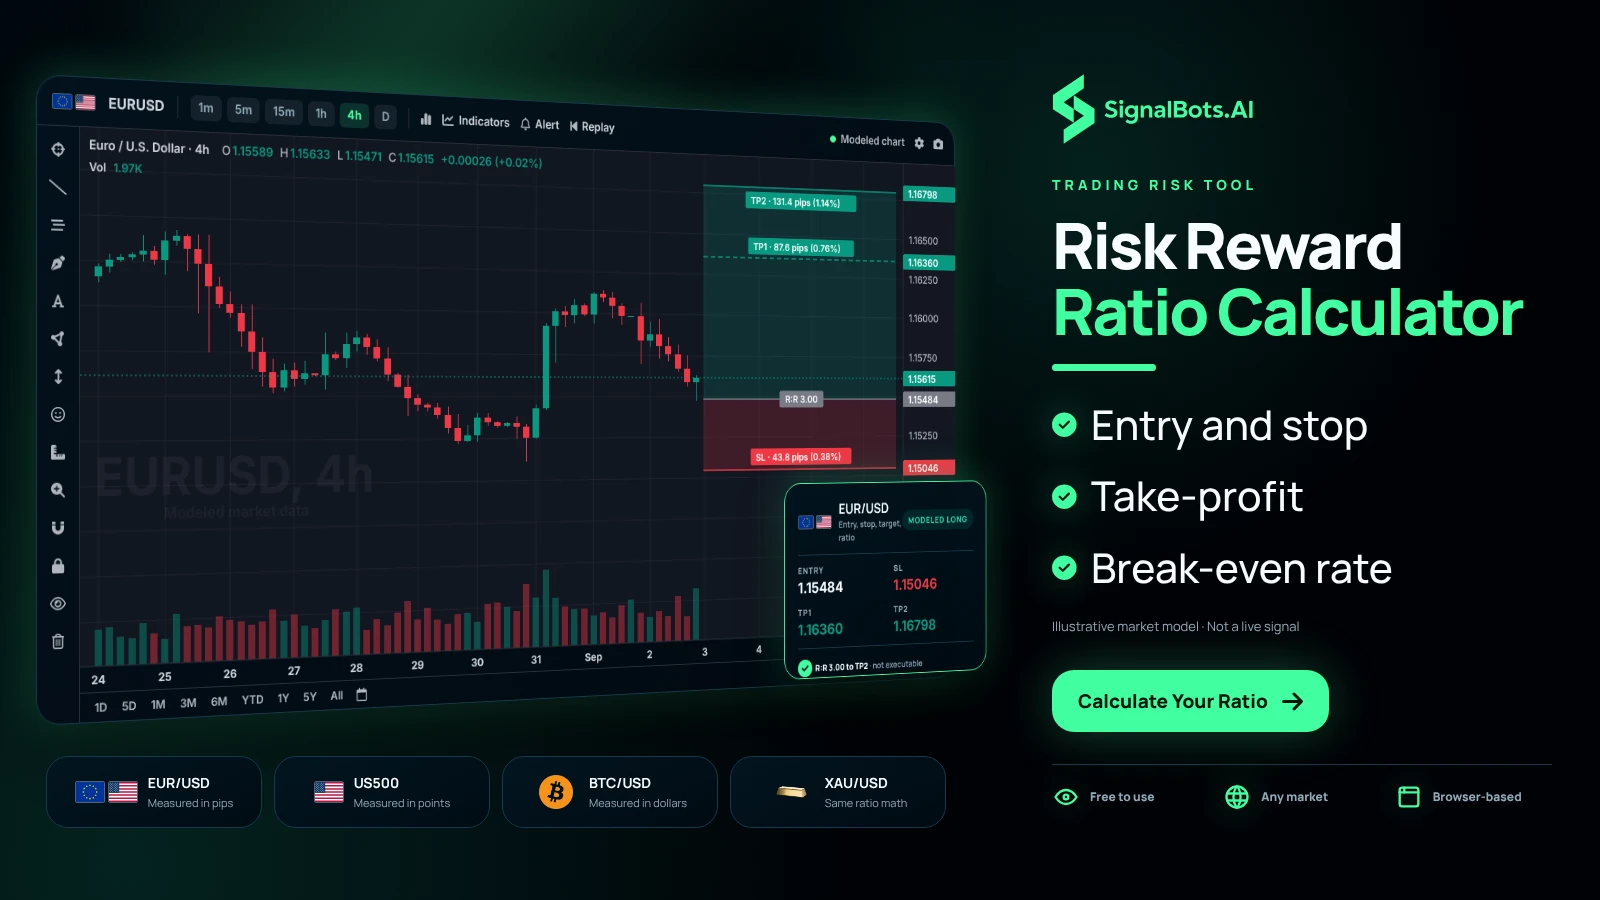
A EURUSD 4h chart with entry, stop-loss below and two take-profit levels above marked, a reward-to-risk 3.00 plan card, and four market cards for EUR/USD, US500, BTC/USD and XAU/USD.
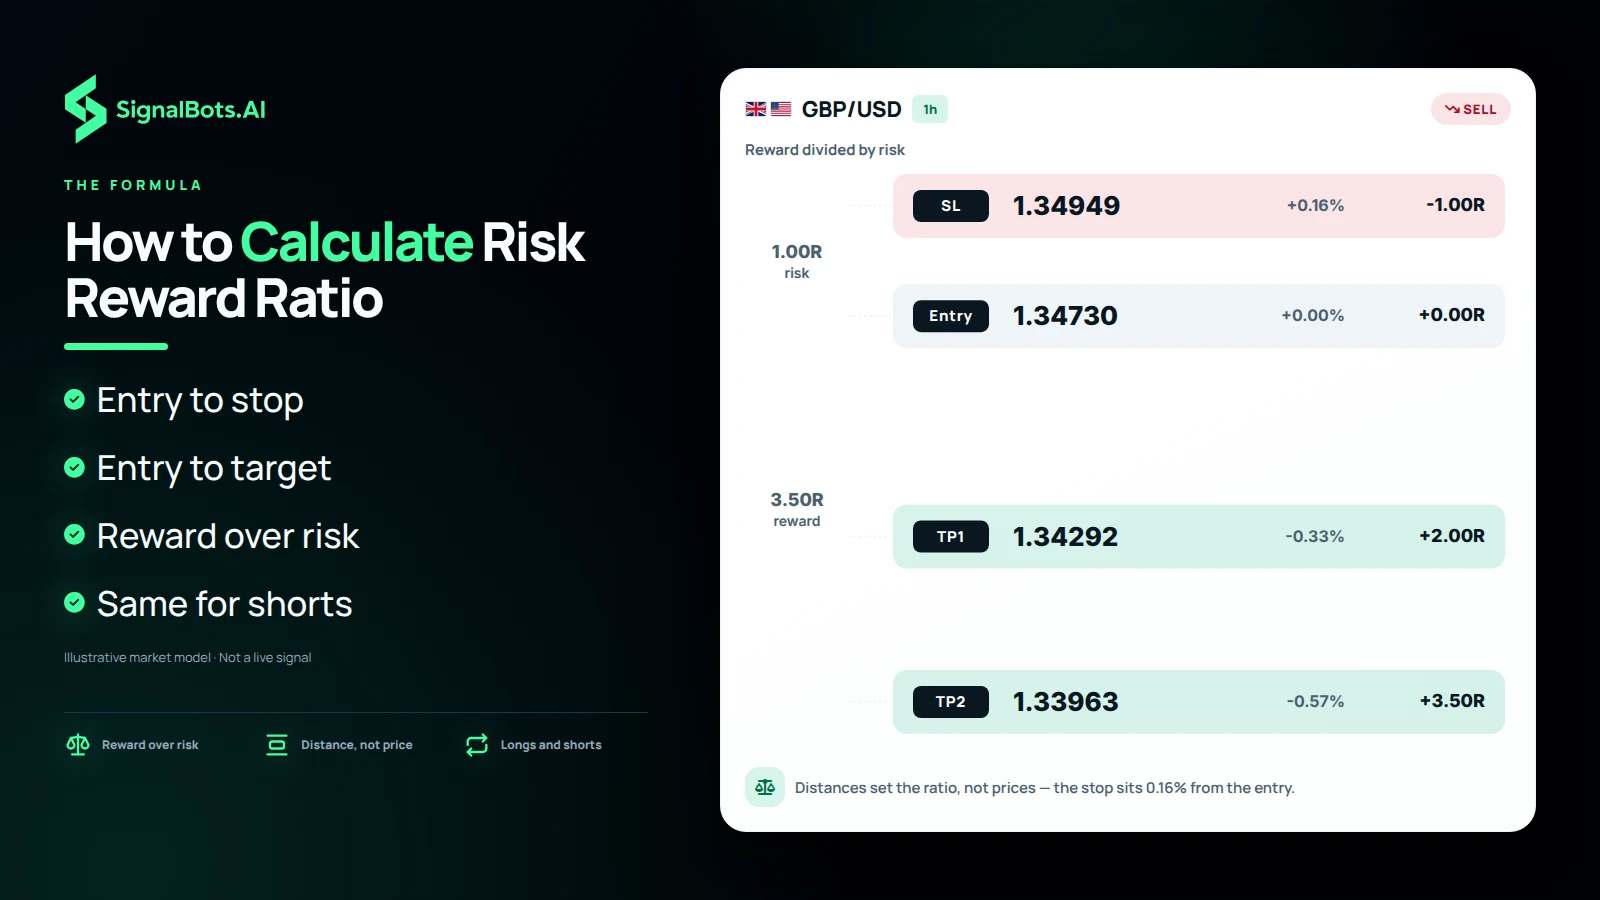
A GBPUSD 1h short risk ladder with SL above entry and TP1/TP2 below it, each row's price, percent distance and R multiple labelled.

Formula by hand

How to Calculate Risk Reward Ratio From Price Distances

If you want to know how to calculate risk reward ratio by hand, measure two gaps. Risk is the stop-loss distance, entry minus stop taken as an absolute value, and reward is the gap from entry to take-profit, measured the same way. Divide reward by risk and you have the ratio. With the calculator's default entry of 100 and stop of 95, the risk works out to 5 price units, so whatever take-profit you enter, its distance from entry is divided by 5 to give the ratio. Because both gaps are absolute values, a short trade with its stop above entry and its target below works through the identical formula.

Break-even trade-off

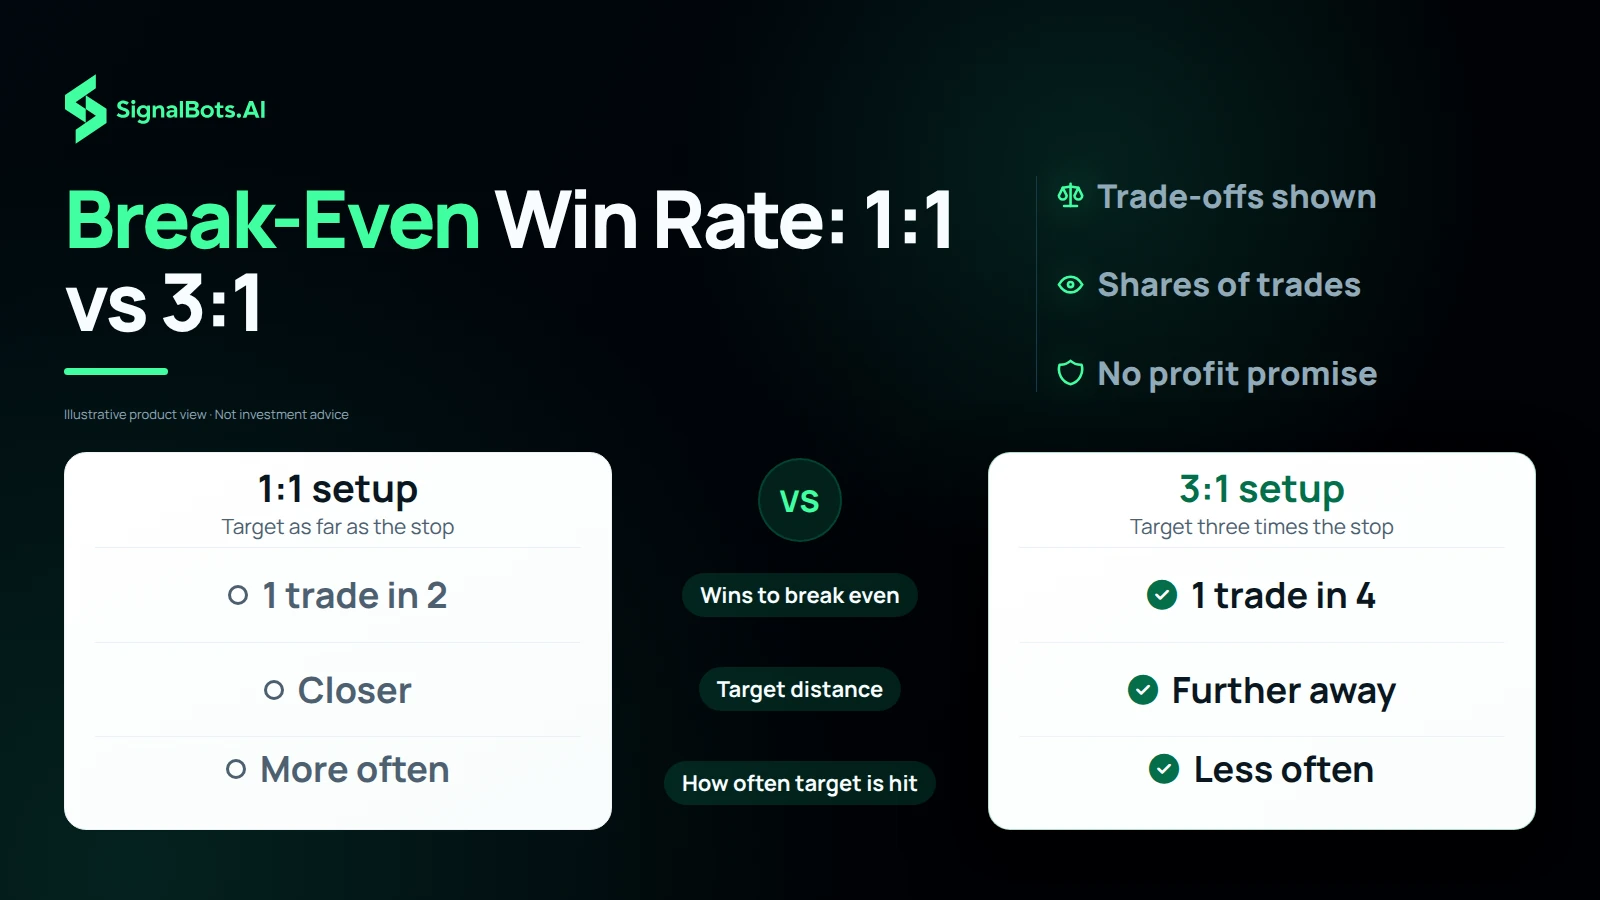
Risk Reward and Break-Even Win Rate: 1:1 Against 3:1

The ratio you plan decides how often you must be right. A 1:1 setup puts the target as far from entry as the stop, so you need to win one trade in two just to break even. A 3:1 setup places the target three times the stop distance away and needs only one winning trade in four to cover the losers. That is the trade-off between risk reward and break even win rate: the more distant target is one price reaches less often, so a higher ratio does not mean profit, and trading carries risk of loss at every ratio.

A two-column comparison of a 1:1 setup and a 3:1 setup across wins needed to break even, target distance and how often the target is hit.
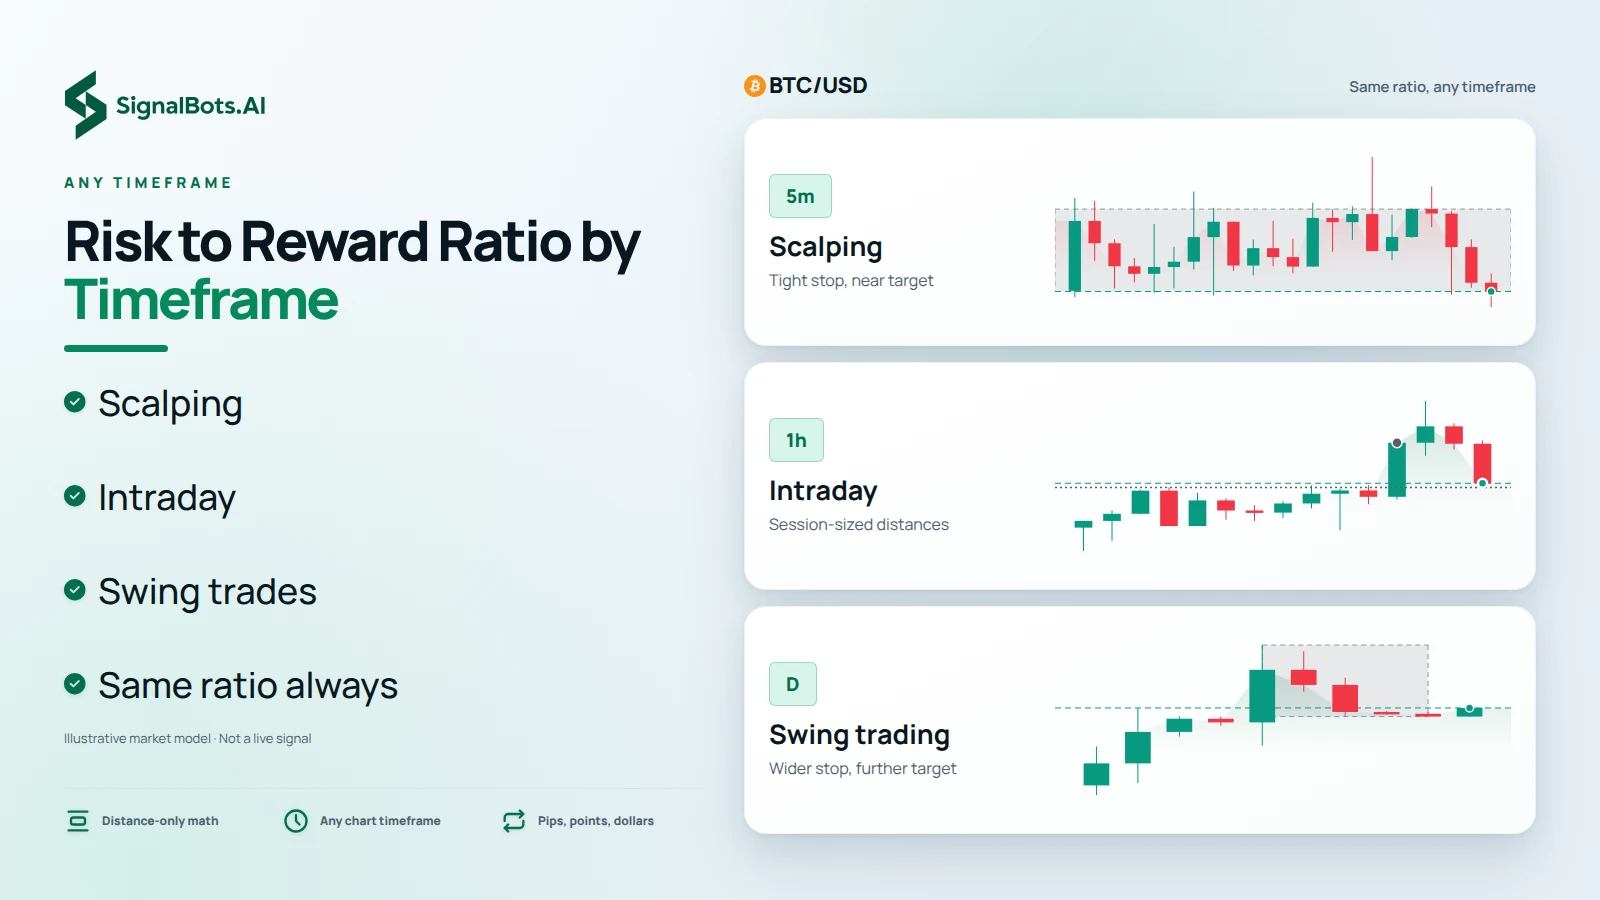
One BTCUSD instrument read on three stacked rungs at 5m, 1h and daily candle sizes, each rung's stop-to-target distance drawn wider than the one above it.

Timeframe fit

Risk to Reward Ratio on Scalping, Intraday and Swing Trades

Because the risk to reward ratio is built only from price distances between entry, stop and target, the math is identical on a five-minute scalp and a daily swing trade. What changes from one timeframe to the next is the size of those distances: scalping usually pairs a tight stop with a near target, an intraday trade uses distances that fit inside one session, and swing trading gives the stop more room and sets the target further out. A 2:1 plan reads 2:1 on any chart, so you can enter prices in pips, points or dollars and compare setups on one scale.

Pre-entry check

What a Good Risk/Reward Ratio Looks Like Before You Enter

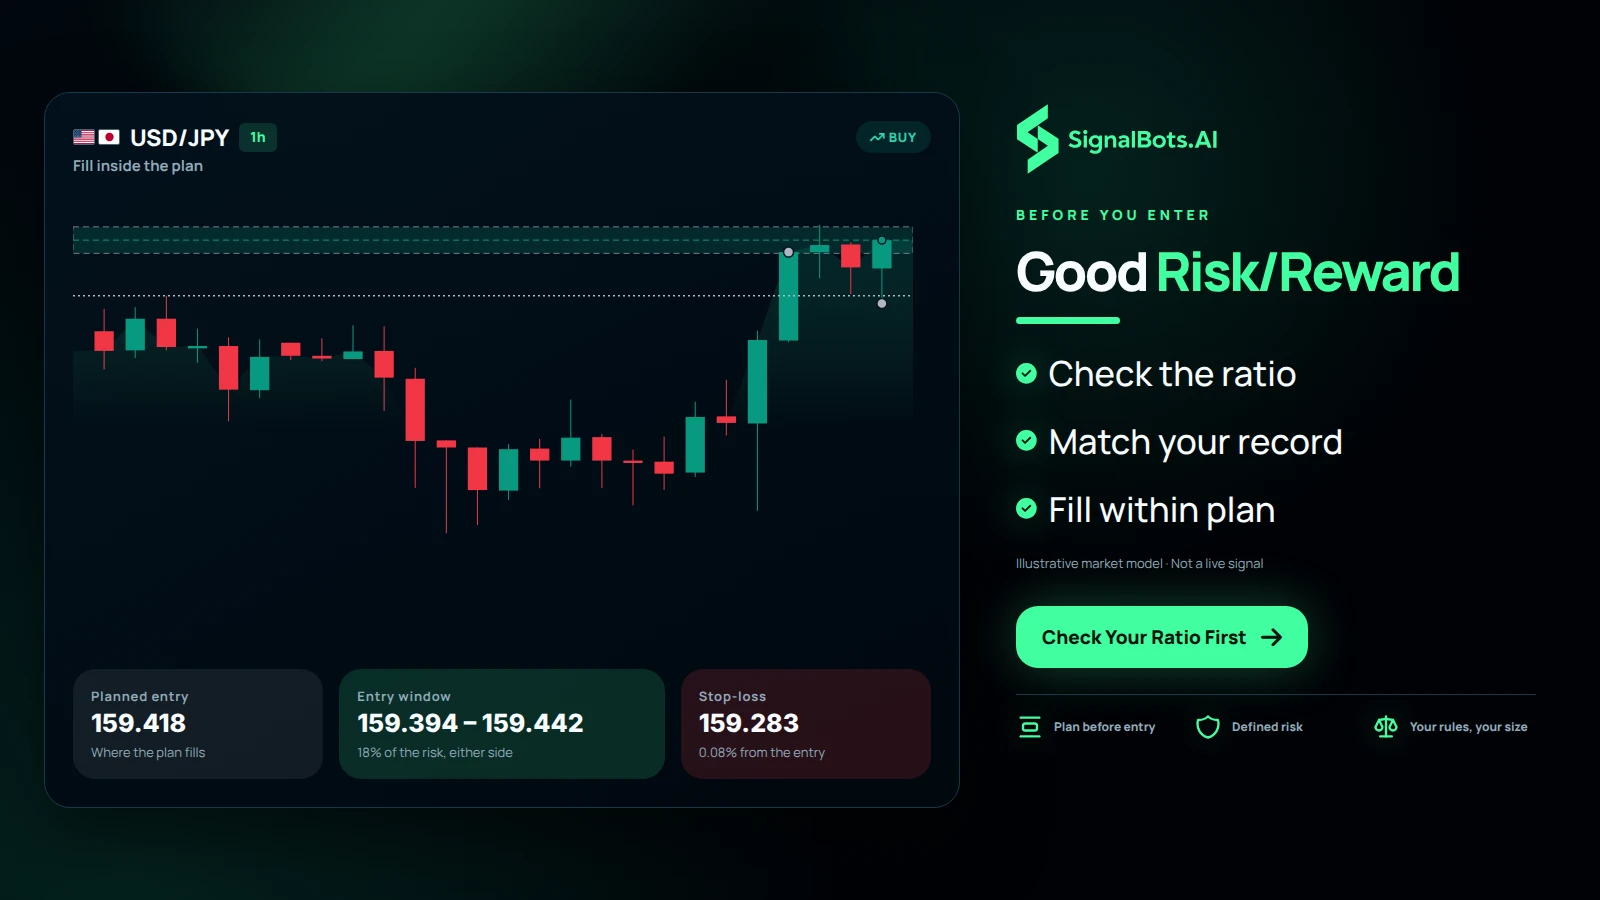
Many traders look for at least 2:1 before they enter, meaning they aim to make twice what they risk, but a good risk/reward ratio only helps when it fits how your strategy actually performs. Before you place the order, run your entry, stop-loss and take-profit through the calculator, then compare its break-even win rate with your own track record of wins and losses. If price has already moved past your planned entry, enter the new fill price, because a late entry with the same stop and target leaves less reward for more risk. Trading carries risk of loss, so treat the ratio as a filter.

A USDJPY 1h long breakout retest with the planned entry, entry window band, and stop-loss drawn beside cards for planned entry, entry window and stop-loss.
Built for your broker

Keep your broker. Keep your edge.

No switching accounts, no relearning a platform. Whichever Forex broker you already trust, SignalBots plugs straight in with extensions, robots, connectors and live signals tuned to it.