You already know how to read an alert. AAPL · CALL · 15M is the same four fields you have parsed a hundred times on EUR/USD. So you take it — and nothing behaves the way it should. The candle never fills. The price sits frozen for eleven hours. Or it opens twelve dollars away from where the signal was measured, in the direction you picked, and you still lose because your expiry passed while the exchange was dark.
Nothing was wrong with the signal. What was wrong was the mental model underneath it. Currency trades continuously from Sunday evening to Friday afternoon, and its shocks arrive from a macro calendar shared by every pair. A single stock trades for six and a half hours a day, sits closed for the other seventeen and a half plus weekends, and carries a scheduled, private, quarterly event that can move it further in one instant than a whole normal month. Every one of those differences lands on the signal you are holding.
This guide covers the part every general signal article skips: what actually changes when the underlying is a company instead of a currency pair. When stock binary contracts are genuinely tradable, how earnings rewrite a signal's assumptions, what a broker's weekend "OTC" stock asset really is, which corporate events silently invalidate a level, and how to size a stake when the risk arrives on a calendar. It assumes you already know how a binary options signal strategy works in general — this is the stock lens laid over it.
Key Takeaways
A stock underlying trades roughly six and a half hours a day, so a signal's timestamp, the exchange session and your broker's quoting window are three separate clocks you must convert onto one before judging whether the alert is live.
US companies report outside the session, so earnings arrive as a gap rather than through a range — the one assumption every technical signal depends on. Know the report date and whether it lands before the open or after the close.
Weekend "OTC" stock assets are broker-generated price series, not the exchange-listed stock; levels, indicators and historical win rates built on real data do not transfer to them.
Ex-dividend dates, splits and halts move or freeze price for reasons no indicator can see, and what happens to a live contract during a halt is your broker's contract terms, not a market rule.
Table of Contents (33 min read)Contents
What Makes a Stock Binary Signal Different From a Forex or Index One?
Four structural differences do almost all the damage, and they compound.
The underlying is closed most of the time. The US regular session runs 9:30 a.m. to 4:00 p.m. Eastern, Monday to Friday, minus market holidays. A five-minute binary options signal on a currency pair at 3:00 a.m. UTC references a market that is genuinely trading. The same signal on a stock ticker at 3:00 a.m. UTC references either nothing at all, a thin extended-hours tape, or a price the broker generated itself. Those are three completely different instruments wearing the same ticker.
The event risk is scheduled, discrete and private to one issuer. Forex volatility clusters around releases everybody can see on the same economic calendar, and it arrives as a burst inside a live market. A company's quarterly report lands in a closed market, on a date the company chose, and the price adjusts in a single jump the next time the exchange opens. There is no equivalent in a currency pair, and an index dilutes it across dozens of names.
The price can change for reasons that are not price action at all. A dividend ex-date mechanically marks the stock down. A split rebases the entire chart. A halt stops the tape mid-signal. None of these are supply and demand meeting at a level — they are administrative events that your indicator has no way to anticipate and, depending on the feed, may not even display correctly afterwards.
The tradable list is short and heavily correlated. Forex gives you dozens of pairs across genuinely different economies. A binary broker's stock menu is typically a handful of US mega-caps, most of them in the same two or three sectors. Trading three of them at once is much closer to one concentrated position than to three independent ones.
Put together, these mean a stock signal is not a forex signal pointed at a different symbol. The expiry you choose, the hours you are allowed to act, the events that can void your premise, and the correlation across your open tickets all change at once.
How Earnings Announcements Move Stock Binary Signals
Earnings are the defining stock-specific risk, and the reason is a timing quirk more than a volatility one: US companies overwhelmingly report outside the regular session — before the open or after the close — precisely so the market has a pause in which to digest the numbers.
That scheduling decision is what breaks naive signal reading. Because the release lands while continuous trading is stopped, the adjustment does not walk through the intervening prices. It appears as a price gap between one session's close and the next session's open. Your binary contract does not care how the price got there — but every technical model that produced your signal implicitly assumed price would get there continuously, through a range consistent with recent behaviour. On a report day, that assumption is simply void.
The Three Positions a Signal Can Occupy Relative to a Report
Entirely before the release. Safest of the three, but not neutral. In the sessions leading into a scheduled report, many names trade a narrower, more directionless range than usual — participants who would otherwise take a side wait for the numbers instead. That is a genuine market regime change, not noise. Breakout and momentum signals fire into a range that keeps failing, so false signals cluster in exactly the days before a report.
Straddling the release. This is where accounts get hurt. Consider a fifteen-minute contract opened at 3:55 p.m. Eastern on a company reporting at 4:05 p.m. Either the contract expires at 4:10 p.m. with the underlying no longer printing on the exchange — and settlement then depends entirely on what price source your broker's contract terms specify — or the platform pulled the asset before you could enter and the signal was never actionable. Neither outcome has anything to do with whether your directional read was correct.
After the release, into the reaction session. The opening minutes of a post-earnings session are the widest and most reflexive part of that stock's month. A gap frequently gets partially retraced, extended, then retraced again inside the first half hour, as overnight orders clear and the price discovers a level. Short-expiry signals calibrated on ordinary sessions systematically understate how far price can travel here — and you can be directionally right about the day and still finish out of the money at a five-minute expiry.
Why a technical model breaks on report day
A report doesn't move price through a range — it jumps the candleStock (illustrative)Daily
A report doesn't move price through a range — it jumps the candle from one session's close to the next session's open.
What This Does to a Provider's Track Record
A feed's historical win rate on stock assets is an average over two very different populations: ordinary sessions, and the four report-adjacent windows each name gets per year. Those windows are a small share of the calendar but carry a disproportionate share of the range, so the blended number tells you less than usual. If a provider reports per-asset results, look for whether earnings-week trades are broken out. If they are not, assume the ordinary-session performance is somewhat better than the headline and the earnings-week performance is somewhat worse.
The practical rule is short: before you take any stock signal, know the report date and whether the company reports before the open or after the close. Not the week — the date and the side of the session. A signal that is perfectly reasonable on a Tuesday is a coin flip on the Thursday afternoon before an after-close release.
Reading Signal Timing Around Market Hours
Three clocks govern binary options stock signals, and traders routinely collapse them into one:
The signal's timestamp — usually the provider's server time, in UTC or the platform's local time.
The exchange session — always Eastern Time, and it shifts against UTC twice a year when US and European daylight-saving changes fall on different dates.
The broker's contract availability — the window in which that specific asset is actually quotable on that specific platform, which is often narrower than the exchange session.
Convert all three onto one clock before you judge anything. A signal that looks fresh can be a stale signal simply because the market it references closed forty minutes ago, and a signal that looks stale may be perfectly current if you misread the timezone offset.
Regular Session vs Pre-Market and After-Hours Windows
The regular session is where a technical signal's assumptions are closest to true. Participation is deepest, the consolidated tape and the national best bid and offer exist, and the price you see is the price the whole market sees. Most binary brokers quote stock assets only inside this window, and some trim the first and last minutes.
Extended-hours sessions — pre-market and after-hours — are a different animal. Liquidity is thinner, quotes are wider, order flow is scattered across venues without a consolidated best price, and a modest order can move the quote noticeably. A print at 7:10 a.m. is a real trade, but it is a weak prediction of where the stock opens at 9:30. If your broker does quote a stock asset in extended hours, understand that you are taking a binary on a tape where a single participant can carry price through a strike.
The auctions at either end deserve their own treatment. The opening auction resolves the accumulated overnight imbalance in one print, and the closing auction concentrates the day's largest single volume event. A three-minute contract spanning 9:30 a.m. or 3:58 p.m. is not the same instrument as one at 11:30 a.m., even on the same ticker with the same signal logic.
Read the three windows as three separate reliability tiers. The regular session gives you a real, deep, consolidated market where indicator-derived levels mean what they normally mean. Extended hours give you a real but thin market where levels are technically valid and practically fragile. And the third tier is not the real market at all.
Four windows, four reliability tiers
Pre-Market
Real trades, but thin liquidity and no consolidated best price — a print is real, not predictive of the open.
Regular Session (9:30–4:00 ET)
Deepest liquidity; the consolidated tape exists, so indicator-derived levels mean what they normally mean.
After-Hours
Same thin-liquidity risk as pre-market — a single order can move the quote noticeably.
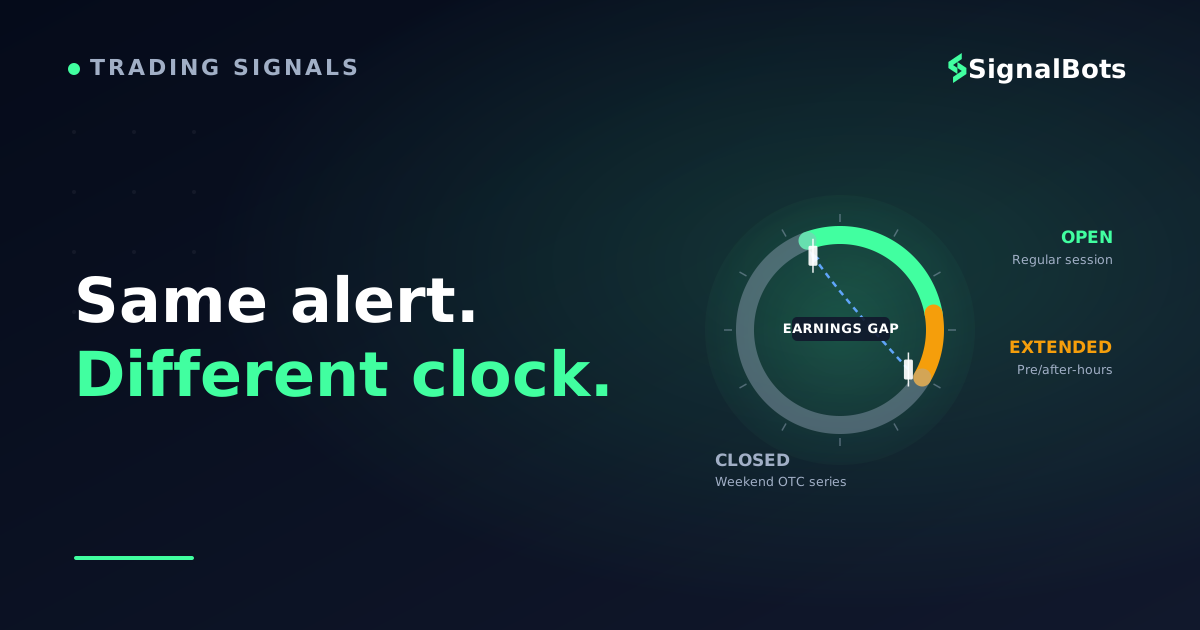
Closed / Weekend OTC
Exchange is dark. Any ‘OTC’ stock asset trading here is a broker-generated series, not the real ticker.
The same signal means something different depending which of these four windows it lands in.
Weekend and OTC "Synthetic Stock" Contracts
Open a binary platform on a Saturday and you will often still see stock assets — listed as something like "Apple OTC" or "Tesla OTC" — available around the clock. Several major binary brokers, Quotex and Pocket Option among them, run these alongside their weekend currency and commodity books.
These are not the exchange-traded stock. They belong to the platform's OTC market offering: the broker generates the price series algorithmically so that it behaves broadly like the underlying, and the broker is your counterparty on the contract. There is no exchange print behind the candle you are looking at. A weekend 'OTC' stock candle is the broker's own price series — the exchange it's named after is closed.
Three consequences follow, and they matter more than the convenience does:
A signal computed on the real ticker does not transfer to the synthetic one. Every support level, indicator reading and backtested result derived from exchange data is out-of-sample the moment you apply it to a broker-generated series. If you want to trade weekend OTC stock assets, they need their own track record, built on their own data.
The link back to the real quote on Monday is a broker policy, not a market law. How the synthetic series reconciles with the exchange price when the exchange reopens — and what happens if the company published news over the weekend — is defined in the platform's contract terms. Read them before you need them.
Counterparty risk is concentrated. With a broker-generated price and a broker-held contract, there is no independent reference to appeal to. This is where checking a platform's registration status stops being paperwork and starts being risk management.
None of this makes weekend contracts illegitimate. It makes them a distinct asset that happens to be named after a stock, and treating them as a substitute for the closed market is the single most expensive assumption in this whole topic.
Which Stocks Do Binary Brokers Typically Cover?
Far fewer than you would expect, and the selection is not random. A binary broker needs an underlying with a reliable continuous data feed, deep enough liquidity that a short-expiry contract cannot be nudged through its strike, and enough retail name recognition to attract volume. That filter produces a list of large, heavily traded US names: Apple, Tesla, Amazon, Microsoft, Alphabet, Meta, Nvidia and Netflix appear on almost every menu, with a rotating tail of consumer and industrial names and a few non-US listings.
What it does not produce is breadth. Three things follow:
Your watchlist is more correlated than it looks. Most of that core list is the same mega-cap technology factor. Three simultaneous open contracts across it is close to one position at triple stake, and a single sector-wide headline resolves them together — in the same direction.
You often cannot trade the catalyst you actually researched. The mid-cap with the interesting setup is not listed, and substituting the nearest large-cap in the same sector replaces your thesis with a proxy for it.
Payout percentages on stock assets are frequently set below the currency majors', and they move with the session. A lower payout raises the win rate you need just to break even, so check the number on the ticket rather than carrying an assumption over from your forex trading. The break-even win rate calculator turns the payout on screen into the hit rate it demands.
If what you actually want is exposure to a sector-wide move rather than a specific company, a US index asset usually offers longer quoting hours and no single-issuer event risk. That is a genuinely different trade, and often a better fit for the thesis you had.
Corporate Actions That Can Break a Stock Signal
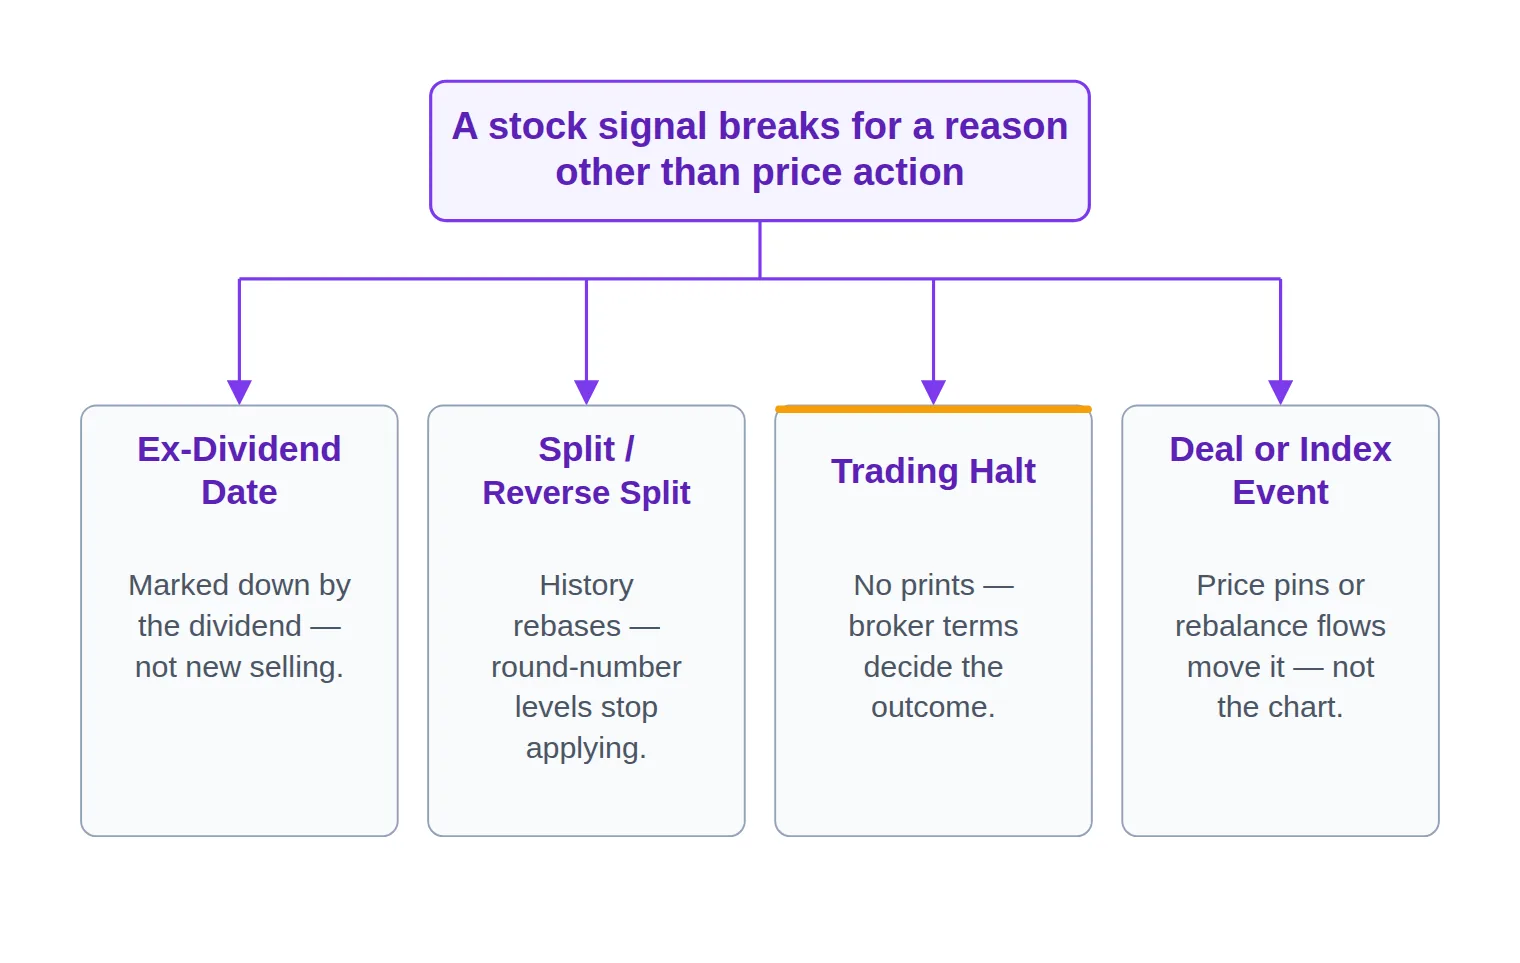
These are stock-only failure modes. They have no forex equivalent, and without them you have no explanation for a signal that suddenly stopped matching price action.
Ex-dividend dates. On the ex-date, a stock is expected to open lower by roughly the dividend amount, all else equal. That drop carries no information — nobody sold anything, the entitlement simply moved. An overnight or early-morning contract can resolve on that mechanical adjustment alone, and a support level a few cents below the previous close can be taken out by arithmetic.
Splits and reverse splits. A split rebases the entire price history at once. Round-number levels, one-touch barriers and any strike specified in absolute terms become meaningless overnight. Some data feeds back-adjust the full history cleanly, others splice the new series onto the old, and a signal generated from an unadjusted feed will point at prices the stock will never see again.
Trading halts. News halts pause a stock while material information is disseminated. Volatility pauses trigger when price runs outside a band around a rolling reference, freezing the tape for a few minutes at a time, and they can re-trigger. Regulatory suspensions last far longer. In every case no prints occur while the halt is on — and what happens to a live binary contract during one is defined by your broker's terms, not by market rules. Some void the contract, some settle on the last available price, some extend expiry. Find out which before it happens to you.
Deal and index events. An acquisition target's price pins near the announced deal price and its volatility collapses; momentum signals on a pinned stock generate almost pure noise. Index additions and removals create mechanical demand around the rebalance date that has nothing to do with the chart.
Four ways a stock's price can move for a reason your indicator can't see.
A thirty-second pre-trade check covers all of it: is there a report between now and expiry, is today an ex-date, has the company announced a split or a deal, and is the stock currently trading normally right now.
Managing Risk on Stock Binary Trades
On a binary contract a loss costs the entire stake while a win returns only the payout, so the reward-to-risk ratio is fixed before you enter and sits below one-to-one. That is true on every asset. What stocks change is when the risk shows up: not spread evenly across the week, but concentrated into a handful of dates you can see in advance.
Five adjustments follow from that.
Treat earnings-adjacent sessions as a separate sizing bucket. Cut the stake, or skip the window entirely. The one thing to never do is increase stake to recover — a martingale progression running into a gap does not get a second chance to be right.
Cap correlated exposure explicitly. Set a correlated exposure cap counting your mega-cap tech tickets as one position, because a sector headline settles them as one.
Match expiry to the character of the window. A short expiry across the open, the close or the first minutes after a gap is a different bet from the same expiry at midday, even with an identical signal.
Keep a separate record for stock assets. Different regime, different payout, different sample size — blending them into your forex results hides both. A money management calculator is the right place to work out what per-trade stake your stock bucket can carry on its own.
Plan for clustered losses, not independent ones. One gap can produce consecutive losses across every correlated name simultaneously. Size for the worst plausible cluster, not for the worst single trade.
Whatever a signal's record looks like, trading binary options carries the risk of losing your full stake on every contract; our risk warning sets out what that means before you commit capital.
Seeing a Stock Binary Signal in Practice
Put it together on a hypothetical ticket. A signal arrives: MSFT · CALL · 30M, timestamped 14:12 UTC, payout 78%. Before the direction matters at all, run the stock overlay — five questions, in this order, each one able to kill the trade on its own.
Is the exchange open through expiry? 14:12 UTC is 10:12 a.m. Eastern in the northern-hemisphere summer, so the regular session has been running for forty minutes and a thirty-minute contract expires comfortably inside it, well clear of both auctions. Good.
Is this the real ticker or the OTC synthetic? Read the asset name on the ticket rather than the chart. An OTC suffix on a Wednesday morning means you have the broker-generated series selected while the exchange itself is open beside it — and every level the signal was measured on belongs to the other instrument.
Is there a scheduled event between now and expiry? Report date first, then the ex-dividend date, then any pending announcement. Thirty minutes is a short window, but a company that reported before this morning's open has already gapped, and a signal calibrated on last week's range is reading a chart the market has moved past.
Is the stock trading normally right now? A halted stock still shows a last price, so a chart that stopped updating a few minutes ago is not evidence of a platform fault. Confirm prints are still arriving before you read a flat candle as consolidation.
What does the payout demand? At 78%, a winning contract returns less than a losing one costs, so you need meaningfully more than half of them to finish in the money simply to stand still — before any errors of timing.
Only after those five does the call or put direction deserve your attention. That sequence is the whole skill — the signal tells you what someone's model thinks; the overlay tells you whether the model's assumptions currently hold.
If you want to practise that overlay against live alerts rather than a worked example, our binary options signal feed collects every binary alert on one page — entry direction and expiry, whatever the underlying it fires on — free to view. It is a feed to read alongside your own earnings calendar and risk plan, not an earnings-timing tool and not auto-execution: you still judge whether the session, the event calendar and the payout justify the trade, and you still place it yourself. On a currency pair the first four checks above are trivial. The value of running them as a habit is that on the day a stock ticker turns up in the feed, you already have the sequence.
Where Stock Signals Fit in Your Broader Toolkit
Stock binaries are a narrow, calendar-driven instrument. A short daily window, a short list of correlated tickers, payouts that usually trail the majors, and four dates a year per name where the dominant risk is not technical at all. That is not an argument against trading them. It is an argument for trading them deliberately — as a scheduled activity built around an earnings calendar, rather than the continuous background hum that forex can be.
The reading skill transfers in one direction only. Everything you learned about parsing an alert on a currency pair still applies; nothing you learned about when to act does. So keep the stock bucket separate: its own record, its own stake size, its own no-trade windows. If you also follow high-low contracts or one-touch contracts on other assets, the contract mechanics carry over unchanged — only the session and event overlay is new. And if you are still surveying which assets binary options signals cover before committing to one, stocks are worth understanding precisely because they are the asset class where a general signal habit fails most quietly.
FAQ
Can you trade binary options on stocks over the weekend?
You can trade an asset named after a stock, but not the stock. Several binary brokers list weekend OTC versions of large-cap tickers whose prices are generated by the broker's own algorithm, because the underlying exchange is closed. They are tradable and legitimate products, but they are a distinct instrument with distinct behaviour — signals and statistics built on real exchange data do not carry over to them.
Should you trade a stock binary option through an earnings report?
For most traders, no. A report released outside the session moves price as a gap rather than through a range, which is exactly the assumption a technical signal depends on. If you do trade the window, do it as an explicit event bet at a reduced stake, with an expiry that sits clearly on one side of the release rather than straddling it.
Why did my stock asset disappear from the platform mid-session?
Usually one of three things: the exchange halted the stock pending news or on a volatility pause, the broker suspended quoting because its price feed became unreliable, or the asset's quoting window is narrower than the exchange session. A halted stock will still display a last price, so the frozen chart is not a platform bug.
Do binary brokers adjust stock prices for dividends and splits?
Practice varies by broker, and it is a contract-terms question rather than a market rule. What matters for signals is that the underlying price itself adjusts mechanically on an ex-dividend date and rebases entirely on a split, so any level, barrier or strike you carried over from before the event needs to be recalculated. Check how your platform's historical chart handles the adjustment too, because an unadjusted chart will produce signals against prices that no longer exist.
Is a stock index a more reliable underlying for binary signals than a single stock?
For signals derived from price action, an index removes single-issuer event risk — no earnings gap, no halt, no split, no ex-date — and typically quotes over longer hours. That usually makes the technical premise more stable. What you give up is the specific company thesis, so the honest answer depends on whether your edge was about the sector or about the name.
How should you choose an expiry for a stock binary signal?
Start from the session rather than the chart. Confirm the expiry lands inside the regular session with room to spare, avoid spanning the opening and closing auctions unless the signal was built for them, and lengthen or skip rather than shorten when a scheduled event sits nearby. Only then match the expiry to the timeframe the signal was generated on.
Sources & Further Reading
Want to go deeper? These independent, authoritative sources shaped this guide — each one is worth reading in full:
The Binary Options Desk is the SignalBots editorial team for fixed-time and OTC trading coverage. We research and write the guides that explain expiry timing, payout structure and disciplined entry across the major brokers.




Discussions 0
Leave a comment