US Indices Signals

Nasdaq 100 (US100) Trading Signals

Real-time Nasdaq 100 (US100) signals with a full trade plan: entry, stop-loss, and take-profit targets, delivered in under 10ms on the web, Telegram, our browser extension and mobile app.

Live Signals
LIVE Last Nasdaq 100 (US100) signal 0 active now
Performance

Recent Results: US Indices

Per-symbol net percentage outcome by day across the last 30 trading sessions. Filter to a symbol to isolate its track.

Monthly Summary: US Indices Click to toggle
Month, Year Total (Net %) US100
Month-to-date 443.0 443.0
September 2026 506.0 506.0
August 2026 249.0 249.0
July 2026 271.0 271.0
June 2026 146.0 146.0

Disclaimer: Past performance does not guarantee future results, and the results shown here represent historical outcomes only and may not be repeated. Please trade and invest with caution; the information provided is for informational purposes only and does not constitute investment or trading advice.

Direction
Get every Nasdaq 100 (US100) signal instantly Web, Telegram, browser extension, and mobile app, all included on any plan.
US100 1 Minute
Buy
Entry 29692.61
Stop Loss 29680.03
TP1 29705.19
TP2 29717.78
TP3 29730.36
TP4 29742.95
TP1 Hit #130114
US100 5 Minutes
Buy
Entry 29665.13
Stop Loss 29612.45
TP1 29717.81
TP2 29770.48
TP3 29823.16
TP4 29875.84
TP3 Hit #130110
US100 5 Minutes
Buy
Entry 29647.58
Stop Loss 29627.72
TP1 29667.44
TP2 29687.29
TP3 29707.15
TP4 29727.00
TP4 Hit #129934
US100 1 Minute
Buy
Entry 29588.67
Stop Loss 29578.46
TP1 29598.88
TP2 29609.09
TP3 29619.30
TP4 29629.51
TP4 Hit #129902
US100 5 Minutes
Buy
Entry 29365.53
Stop Loss 29266.78
TP1 29464.28
TP2 29563.03
TP3 29661.78
TP4 29760.54
TP4 Hit #129899
US100 1 Minute
Buy
Entry 29399.96
Stop Loss 29368.06
TP1 29431.86
TP2 29463.76
TP3 29495.66
TP4 29527.56
Loss #129891
US100 4 Hours
Buy
Entry 29273.39
Stop Loss 28779.05
TP1 29767.73
TP2 30262.07
TP3 30756.42
TP4 31250.76
TP1 Hit #129922
US100 5 Minutes
Buy
Entry 29301.42
Stop Loss 29268.95
TP1 29333.89
TP2 29366.35
TP3 29398.82
TP4 29431.29
TP2 Hit #129714
US100 1 Hour
Sell
Entry 29178.83
Stop Loss 29327.15
TP1 29030.51
TP2 28882.19
TP3 28733.88
TP4 28585.56
Loss #129687
Trade Ledger

Last 20 Signals: US Indices

Date, time Order Price Take Profit Stop Loss State Entry Exit Profit
October 28, 2026 at 3:20 PM GMT Oct 28, 26 15:20 GMT Buy 29692.61 29705.19, 29717.78, 29730.36, 29742.95 29680.03 TP1 Hit 29692.61 29705.19 +125800
October 28, 2026 at 2:10 PM GMT Oct 28, 26 14:10 GMT Buy 29665.13 29717.81, 29770.48, 29823.16, 29875.84 29612.45 TP3 Hit 29665.13 29823.16 +1580300
October 27, 2026 at 7:55 PM GMT Oct 27, 26 19:55 GMT Buy 29647.58 29667.44, 29687.29, 29707.15, 29727.00 29627.72 TP4 Hit 29647.58 29727.00 +794200
October 27, 2026 at 3:35 PM GMT Oct 27, 26 15:35 GMT Buy 29588.67 29598.88, 29609.09, 29619.30, 29629.51 29578.46 TP4 Hit 29588.67 29629.51 +408400
October 27, 2026 at 2:15 PM GMT Oct 27, 26 14:15 GMT Buy 29365.53 29464.28, 29563.03, 29661.78, 29760.54 29266.78 TP4 Hit 29365.53 29760.54 +3950100
October 27, 2026 at 1:55 PM GMT Oct 27, 26 13:55 GMT Buy 29399.96 29431.86, 29463.76, 29495.66, 29527.56 29368.06 Loss 29399.96 29368.06 -319000
October 26, 2026 at 9:30 PM GMT Oct 26, 26 21:30 GMT Buy 29273.39 29767.73, 30262.07, 30756.42, 31250.76 28779.05 TP1 Hit 29273.39 29767.73 +4943400
October 26, 2026 at 5:45 PM GMT Oct 26, 26 17:45 GMT Buy 29301.42 29333.89, 29366.35, 29398.82, 29431.29 29268.95 TP2 Hit 29301.42 29366.35 +649300
October 26, 2026 at 2:30 PM GMT Oct 26, 26 14:30 GMT Sell 29178.83 29030.51, 28882.19, 28733.88, 28585.56 29327.15 Loss 29178.83 29327.15 -1483200
October 26, 2026 at 2:05 PM GMT Oct 26, 26 14:05 GMT Sell 29077.58 28976.28, 28874.97, 28773.67, 28672.36 29178.88 Loss 29077.58 29178.88 -1013000
October 26, 2026 at 1:45 PM GMT Oct 26, 26 13:45 GMT Buy 29066.78 29097.16, 29127.53, 29157.91, 29188.29 29036.40 TP2 Hit 29066.78 29127.53 +607500
October 23, 2026 at 3:55 PM GMT Oct 23, 26 15:55 GMT Sell 29106.63 29062.46, 29018.28, 28974.11, 28929.93 29150.80 TP3 Hit 29106.63 28974.11 +1325200
October 23, 2026 at 3:00 PM GMT Oct 23, 26 15:00 GMT Sell 29129.36 29012.71, 28896.05, 28779.40, 28662.74 29246.01 TP1 Hit 29129.36 29012.71 +1166500
October 22, 2026 at 5:40 PM GMT Oct 22, 26 17:40 GMT Sell 29034.87 29012.75, 28990.64, 28968.52, 28946.41 29056.99 TP4 Hit 29034.87 28946.41 +884600
October 22, 2026 at 4:00 PM GMT Oct 22, 26 16:00 GMT Sell 29161.88 29111.46, 29061.05, 29010.63, 28960.21 29212.30 TP4 Hit 29161.88 28960.21 +2016700
October 21, 2026 at 8:30 PM GMT Oct 21, 26 20:30 GMT Sell 29822.51 29680.64, 29538.78, 29396.91, 29255.05 29964.38 TP4 Hit 29822.51 29255.05 +5674600
October 21, 2026 at 7:00 PM GMT Oct 21, 26 19:00 GMT Sell 29783.18 29624.62, 29466.07, 29307.51, 29148.95 29941.74 TP4 Hit 29783.18 29148.95 +6342300
October 21, 2026 at 4:30 PM GMT Oct 21, 26 16:30 GMT Buy 29814.09 29844.36, 29874.64, 29904.91, 29935.19 29783.82 TP3 Hit 29814.09 29904.91 +908200
October 21, 2026 at 4:05 PM GMT Oct 21, 26 16:05 GMT Buy 29843.22 29852.36, 29861.50, 29870.64, 29879.78 29834.08 Loss 29843.22 29834.08 -91400
October 20, 2026 at 4:10 PM GMT Oct 20, 26 16:10 GMT Sell 29577.50 29545.50, 29513.49, 29481.49, 29449.49 29609.50 TP2 Hit 29577.50 29513.49 +640100
Binary Options

US100 Binary Signals

The binary options record for US100: strike, direction and expiry on every call, settled Win, Loss or Tie.

Performance

Recent Results: Binary Options

Wins and losses by day across the last 30 trading sessions. Filter to a symbol to isolate its track.

Monthly Summary: Binary Options Click to toggle
Month, Year Total (Payout pts) US100
Month-to-date 1,655 1,655
September 2026 930 930
August 2026 650 650
July 2026 170 170
June 2026 505 505

Binary Options Signal Cards

US100 4 Hours
Call
Strike 29651.43
Expiry 4 Hours
Strategy SB Rules v1
Win #130130
US100 5 Minutes
Call
Strike 29651.43
Expiry 5 Minutes
Strategy SB Rules v1
Win #130102
US100 5 Minutes
Put
Strike 28958.68
Expiry 5 Minutes
Strategy SB Rules v1
Win #129290
US100 30 Minutes
Put
Strike 29822.51
Expiry 30 Minutes
Strategy SB Rules v1
Win #129097
US100 1 Hour
Put
Strike 29822.51
Expiry 1 Hour
Strategy SB Rules v1
Win #129103
US100 1 Minute
Put
Strike 29499.17
Expiry 1 Minute
Strategy SB Rules v1
Win #128729
Trade Ledger

Last 20 Signals: Binary Options

Date, time Direction Strike Expiry State Result Payout
October 27, 2026 at 9:30 PM GMT Oct 27, 26 21:30 GMT Long 29651.43 4 Hours Settled Win +85
October 27, 2026 at 8:05 PM GMT Oct 27, 26 20:05 GMT Long 29651.43 5 Minutes Settled Win +85
October 22, 2026 at 8:05 PM GMT Oct 22, 26 20:05 GMT Short 28958.68 5 Minutes Settled Win +85
October 21, 2026 at 8:30 PM GMT Oct 21, 26 20:30 GMT Short 29822.51 1 Hour Settled Win +85
October 21, 2026 at 8:30 PM GMT Oct 21, 26 20:30 GMT Short 29822.51 30 Minutes Settled Win +85
October 20, 2026 at 7:50 PM GMT Oct 20, 26 19:50 GMT Short 29499.17 1 Minute Settled Win +85
October 15, 2026 at 8:30 PM GMT Oct 15, 26 20:30 GMT Short 29935.58 1 Hour Settled Win +85
October 15, 2026 at 8:30 PM GMT Oct 15, 26 20:30 GMT Short 29935.58 30 Minutes Settled Win +85
October 14, 2026 at 8:05 PM GMT Oct 14, 26 20:05 GMT Short 29950.81 5 Minutes Settled Win +85
October 14, 2026 at 8:01 PM GMT Oct 14, 26 20:01 GMT Short 29950.81 1 Minute Settled Win +85
October 12, 2026 at 9:30 PM GMT Oct 12, 26 21:30 GMT Long 30664.69 4 Hours Settled Loss -100
October 12, 2026 at 8:05 PM GMT Oct 12, 26 20:05 GMT Short 30664.69 5 Minutes Settled Win +85
October 9, 2026 at 9:30 PM GMT Oct 9, 26 21:30 GMT Long 30883.14 4 Hours Settled Loss -100
October 9, 2026 at 8:30 PM GMT Oct 9, 26 20:30 GMT Long 30883.14 30 Minutes Settled Loss -100
October 9, 2026 at 8:05 PM GMT Oct 9, 26 20:05 GMT Short 30883.14 5 Minutes Settled Win +85
October 9, 2026 at 6:30 PM GMT Oct 9, 26 18:30 GMT Long 30882.88 1 Hour Settled Win +85
October 9, 2026 at 4:00 PM GMT Oct 9, 26 16:00 GMT Long 30837.12 30 Minutes Settled Win +85
October 8, 2026 at 9:30 PM GMT Oct 8, 26 21:30 GMT Long 30725.8 4 Hours Settled Win +85
October 7, 2026 at 2:30 PM GMT Oct 7, 26 14:30 GMT Long 31010.16 1 Hour Settled Win +85
October 5, 2026 at 8:05 PM GMT Oct 5, 26 20:05 GMT Long 31076.43 5 Minutes Settled Win +85
Futures

Nasdaq 100 (NQ JUN26) Futures Signals

The futures record for Nasdaq 100 (NQ JUN26): the same instrument traded on the exchange contract, with its own entry, stop and targets.

Performance

Recent Results: Futures

Per-symbol net percentage outcome by day across the last 30 trading sessions. Filter to a symbol to isolate its track.

Monthly Summary: Futures Click to toggle
Month, Year Total (Net %) NQ JUN26
Month-to-date 31.0 31.0
September 2026 67.0 67.0
August 2026 24.0 24.0
July 2026 106.0 106.0
June 2026 27.0 27.0

Futures Signal Cards

NQ JUN26 1 Hour
Buy
Entry 29876.50
Stop Loss 29752.88
TP1 30000.12
TP2 30123.73
TP3 30247.35
TP4 30370.96
TP2 Hit #130155
NQ JUN26 4 Hours
Sell
Entry 29890.25
Stop Loss 30108.49
TP1 29672.01
TP2 29453.77
TP3 29235.53
TP4 29017.29
Loss #128918
NQ JUN26 1 Hour
Sell
Entry 29743.75
Stop Loss 29999.29
TP1 29488.21
TP2 29232.67
TP3 28977.13
TP4 28721.59
TP1 Hit #128516
NQ JUN26 1 Hour
Sell
Entry 30136.00
Stop Loss 30243.94
TP1 30028.06
TP2 29920.11
TP3 29812.17
TP4 29704.23
TP4 Hit #127971
NQ JUN26 4 Hours
Buy
Entry 31123.25
Stop Loss 30767.35
TP1 31479.15
TP2 31835.05
TP3 32190.95
TP4 32546.85
Loss #127020
NQ JUN26 1 Hour
Buy
Entry 31123.25
Stop Loss 30979.13
TP1 31267.37
TP2 31411.49
TP3 31555.60
TP4 31699.72
TP1 Hit #126947
Trade Ledger

Last 20 Signals: Futures

Date, time Order Price Take Profit Stop Loss State Entry Exit Profit
October 28, 2026 at 7:00 PM GMT Oct 28, 26 19:00 GMT Buy 29876.50 30000.12, 30123.73, 30247.35, 30370.96 29752.88 TP2 Hit 29876.50 30123.73 +2472300
October 21, 2026 at 2:00 PM GMT Oct 21, 26 14:00 GMT Sell 29890.25 29672.01, 29453.77, 29235.53, 29017.29 30108.49 Loss 29890.25 30108.49 -2182400
October 19, 2026 at 9:00 PM GMT Oct 19, 26 21:00 GMT Sell 29743.75 29488.21, 29232.67, 28977.13, 28721.59 29999.29 TP1 Hit 29743.75 29488.21 +2555400
October 16, 2026 at 8:00 AM GMT Oct 16, 26 08:00 GMT Sell 30136.00 30028.06, 29920.11, 29812.17, 29704.23 30243.94 TP4 Hit 30136.00 29704.23 +4317700
October 9, 2026 at 10:00 PM GMT Oct 9, 26 22:00 GMT Buy 31123.25 31479.15, 31835.05, 32190.95, 32546.85 30767.35 Loss 31123.25 30767.35 -3559000
October 9, 2026 at 9:00 PM GMT Oct 9, 26 21:00 GMT Buy 31123.25 31267.37, 31411.49, 31555.60, 31699.72 30979.13 TP1 Hit 31123.25 31267.37 +1441200
October 8, 2026 at 10:00 AM GMT Oct 8, 26 10:00 GMT Buy 31227.25 31375.41, 31523.58, 31671.74, 31819.90 31079.09 Loss 31227.25 31079.09 -1481600
October 2, 2026 at 9:00 PM GMT Oct 2, 26 21:00 GMT Buy 31049.00 31199.91, 31350.82, 31501.73, 31652.65 30898.09 TP3 Hit 31049.00 31501.73 +4527300
October 1, 2026 at 10:00 AM GMT Oct 1, 26 10:00 GMT Buy 30853.50 31225.11, 31596.73, 31968.34, 32339.96 30481.89 TP2 Hit 30853.50 31596.73 +7432300
September 29, 2026 at 6:00 PM GMT Sep 29, 26 18:00 GMT Buy 30521.25 30712.93, 30904.62, 31096.30, 31287.98 30329.57 TP4 Hit 30521.25 31287.98 +7667300
September 28, 2026 at 2:00 AM GMT Sep 28, 26 02:00 GMT Buy 30743.00 31096.34, 31449.68, 31803.03, 32156.37 30389.66 Loss 30743.00 30389.66 -3533400
September 27, 2026 at 11:00 PM GMT Sep 27, 26 23:00 GMT Buy 30789.75 30909.76, 31029.78, 31149.79, 31269.81 30669.74 Loss 30789.75 30669.74 -1200100
September 24, 2026 at 4:00 PM GMT Sep 24, 26 16:00 GMT Buy 30560.00 30763.33, 30966.66, 31169.99, 31373.31 30356.67 TP4 Hit 30560.00 31373.31 +8133100
September 24, 2026 at 2:00 PM GMT Sep 24, 26 14:00 GMT Buy 30578.75 30811.56, 31044.36, 31277.17, 31509.98 30345.94 TP4 Hit 30578.75 31509.98 +9312300
September 23, 2026 at 12:05 AM GMT Sep 23, 26 00:05 GMT Buy 31047.00 31059.22, 31071.44, 31083.66, 31095.88 31034.78 Active - - -
September 17, 2026 at 12:05 AM GMT Sep 17, 26 00:05 GMT Buy 29451.00 29468.52, 29486.04, 29503.57, 29521.09 29433.48 Closed 29451.00 - 0
September 15, 2026 at 6:00 PM GMT Sep 15, 26 18:00 GMT Sell 29263.75 29003.54, 28743.33, 28483.12, 28222.91 29523.96 Loss 29263.75 29523.96 -2602100
September 14, 2026 at 10:00 PM GMT Sep 14, 26 22:00 GMT Sell 29193.75 28858.98, 28524.21, 28189.44, 27854.67 29528.52 Loss 29193.75 29528.52 -3347700
September 11, 2026 at 10:00 PM GMT Sep 11, 26 22:00 GMT Sell 29391.75 29230.83, 29069.92, 28909.00, 28748.09 29552.67 TP3 Hit 29391.75 28909.00 +4827500
September 11, 2026 at 6:00 AM GMT Sep 11, 26 06:00 GMT Sell 29233.25 28848.76, 28464.28, 28079.79, 27695.31 29617.74 TP1 Hit 29233.25 28848.76 +3844900
FAQs

Common questions about Nasdaq 100 (US100) signals

How fast do signals reach me?

Every signal pushes to you in under 10 milliseconds from when our engine fires. It lands on the web dashboard, Telegram, our browser extension, and the mobile app at the same time, so you never miss an entry.

What US indices markets do you cover?

Every US indices instrument with a live track record shows up as a card on this page, busiest first. Tap any card to open its full signal history.

What's inside each signal?

A clear direction (Buy or Sell), an entry price, a protective stop loss, and take-profit targets, plus a live status that updates as the trade plays out.

How should I size each trade?

We suggest risking 1–2% of your account per trade. Your position size then follows from the stop distance on each signal and the risk percentage you're comfortable with.

Where can I see past results?

Right on this page: the Recent Results chart and the full statistics panel above show every tracked outcome. We publish the complete record, wins and losses alike.

How will I receive signals?

Through whichever channels suit you: the web dashboard, Telegram, our browser extension, and the mobile app all stay in sync, so each signal reaches you wherever you are.

How do I get VIP access?

VIP access comes with every plan; message our team and we'll set you up.

Do you guarantee profits?

No, and be wary of anyone who does. US Indices trading carries substantial risk. Read our Risk Warning and judge the historical edge for yourself before subscribing.

Can I cancel any time?

Yes. Cancel in one click from your dashboard, no hidden fees and no auto-renewal traps.

Still have questions?

Our team is happy to help before you join; get in touch and we'll walk you through anything you're unsure about.

Trend and swing rules

Nasdaq 100 Trading Signals for Tech-Driven Moves

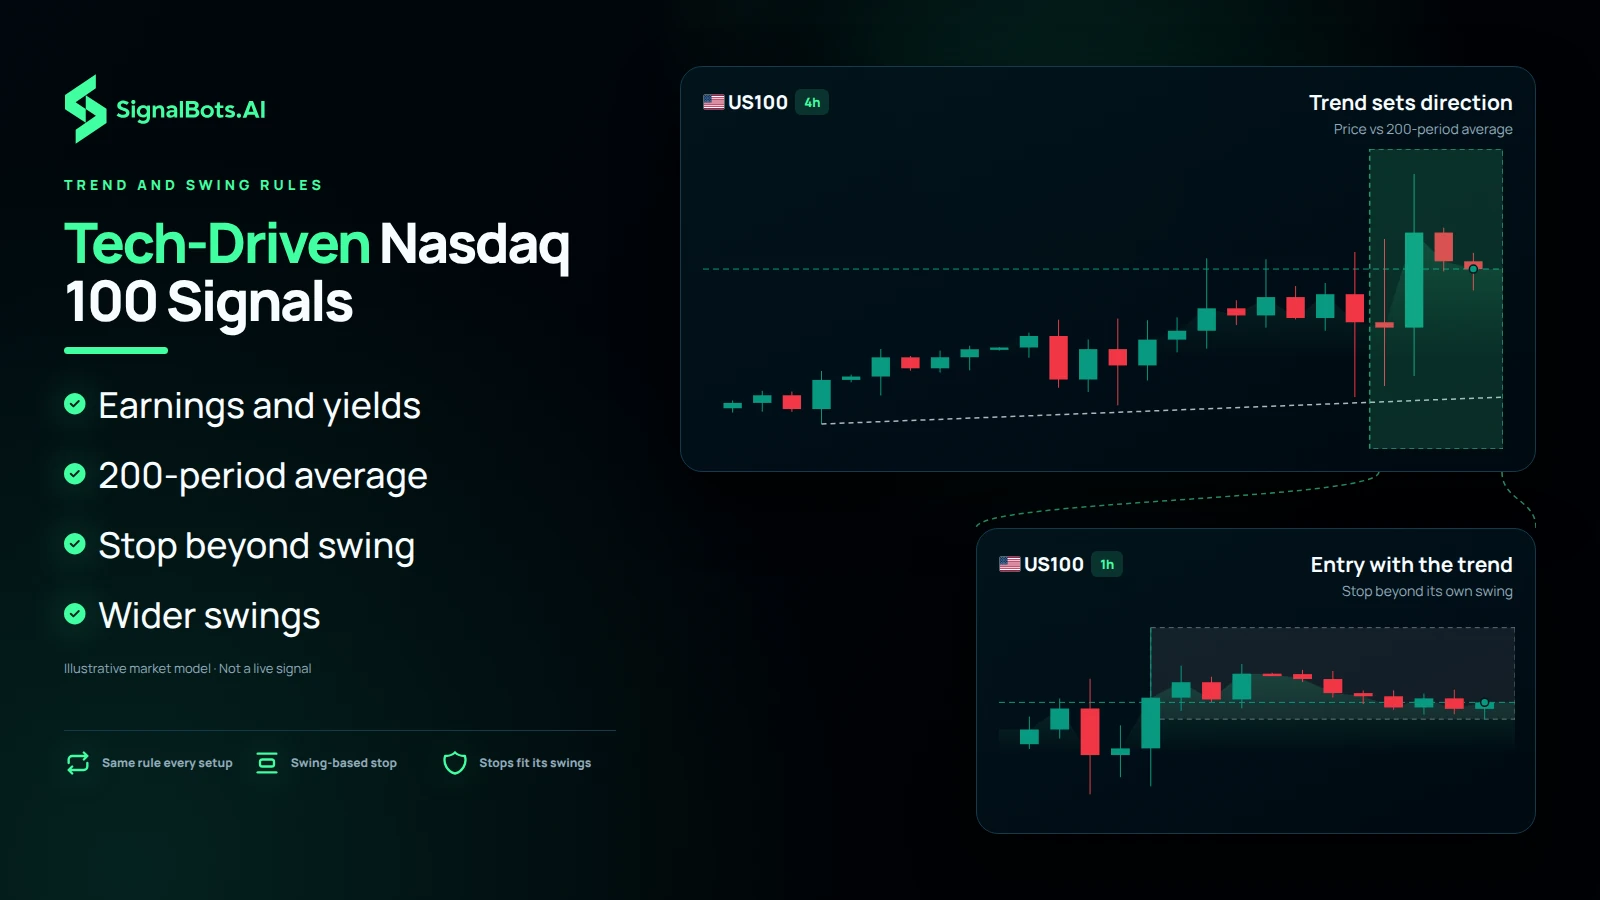
The Nasdaq 100 holds the largest non-financial companies listed on the Nasdaq exchange and is dominated by a handful of technology giants, so their earnings, their spending plans and bond yields drive much of its movement. It usually swings further than the S&P 500. Every US100 signal takes its direction from the 200-period average and sets a stop from the Nasdaq's own recent swings, which run wider than the broad market's.

Dark illustration headlined "Tech-Driven Nasdaq 100 Signals": a US100 4h pane labelled "Trend sets direction, price vs 200-period average" zooms into a 1h pane labelled "Entry with the trend, stop beyond its own swing", beside bullets on earnings and yields, the 200-period average, a stop beyond the swing and wider swings.
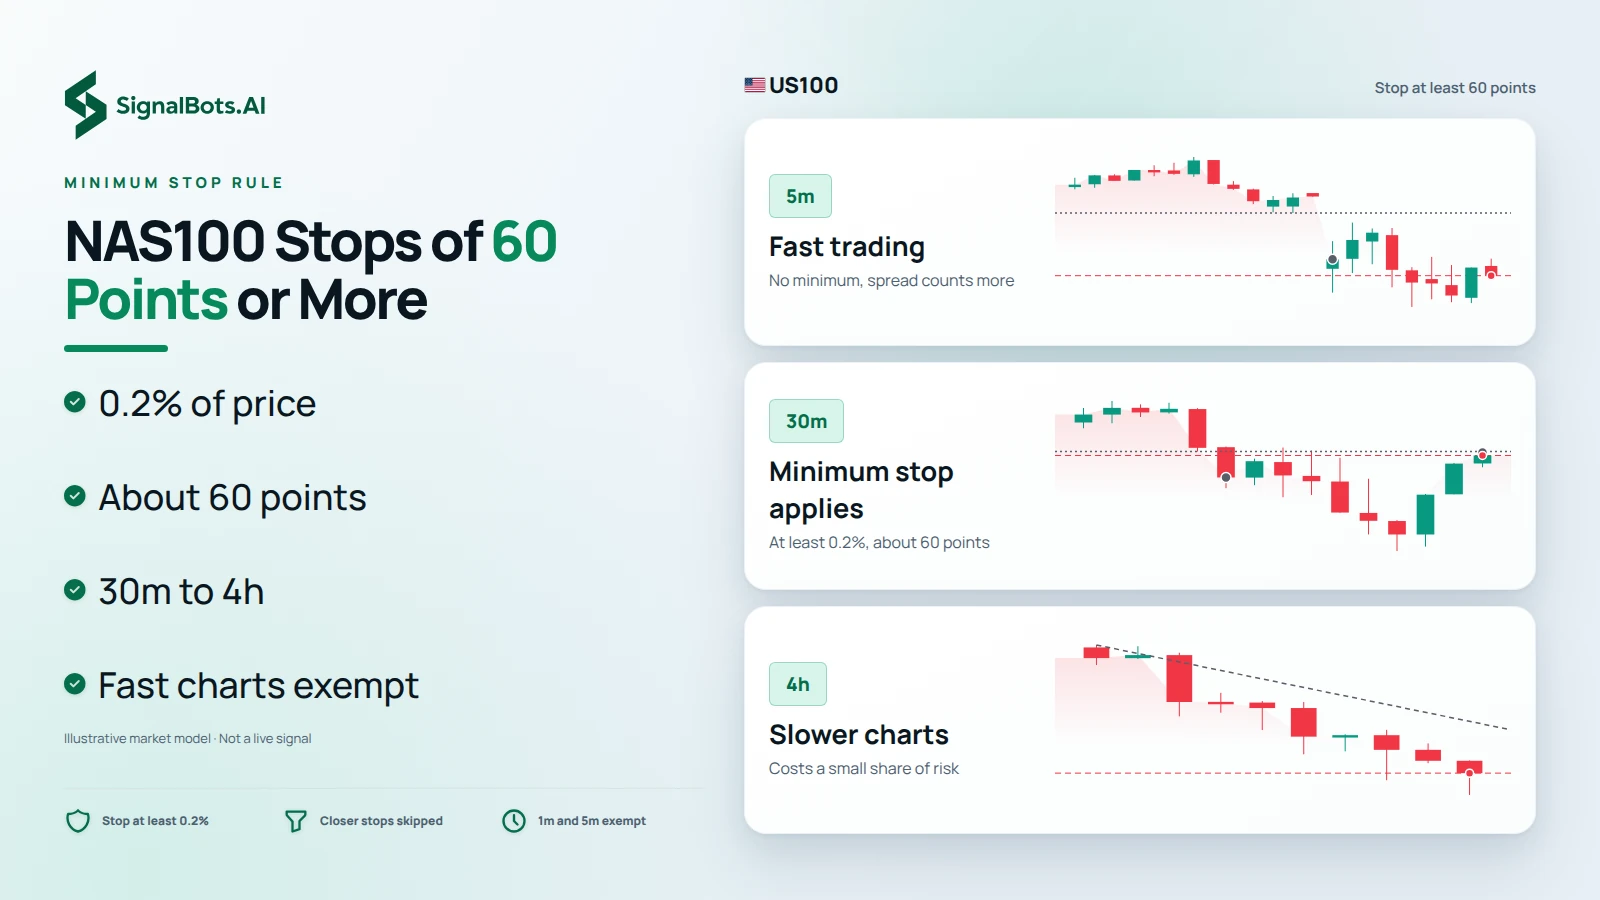
Light illustration headlined "NAS100 Stops of 60 Points or More": US100 charts stacked at 5m "Fast trading, no minimum, spread counts more", 30m "Minimum stop applies, at least 0.2%, about 60 points" and 4h "Slower charts, costs a small share of risk", beside bullets restating the 0.2% rule and the exempt fast charts.

Minimum stop rule

NAS100 Forex Signals with Stops of 60 Points or More

At its current level, the Nasdaq 100's minimum stop on 30m, 1h and 4h charts works out at about 60 points, which is 0.2% of the index. A setup with a closer stop is not published on those charts, because trading costs would take too large a share of the risk. The 1m and 5m NAS100 setups have no minimum and suit fast traders, who should expect the spread to count for more on each target.

Telegram delivery

Nasdaq Trading Signals on Telegram

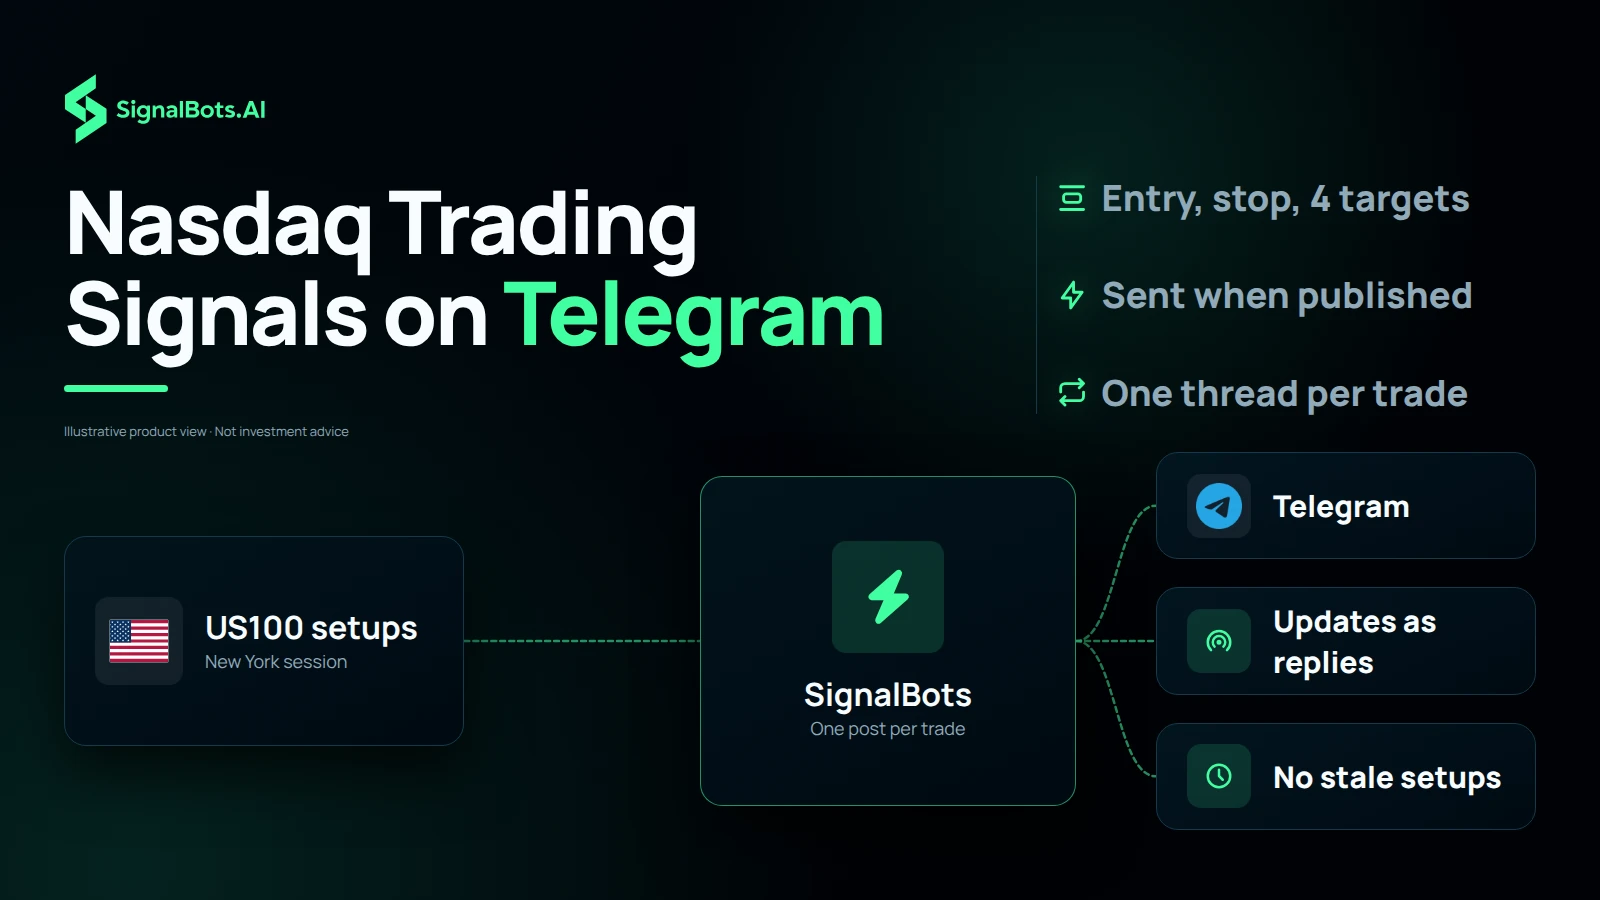
Nasdaq setups are sent to Telegram as soon as they are published during the New York session, each with its entry, stop and four targets. As the index touches those levels, the updates are posted as replies under the original message, so the fast opening hour does not bury a trade under a stack of separate alerts. A setup already more than three candles old is never pushed to the channel.

Dark flow diagram headlined "Nasdaq Trading Signals on Telegram": a US100 setups card from the New York session feeds a SignalBots hub marked "One post per trade", which routes to Telegram, "Updates as replies" and "No stale setups", beside notes on entry, stop and four targets.
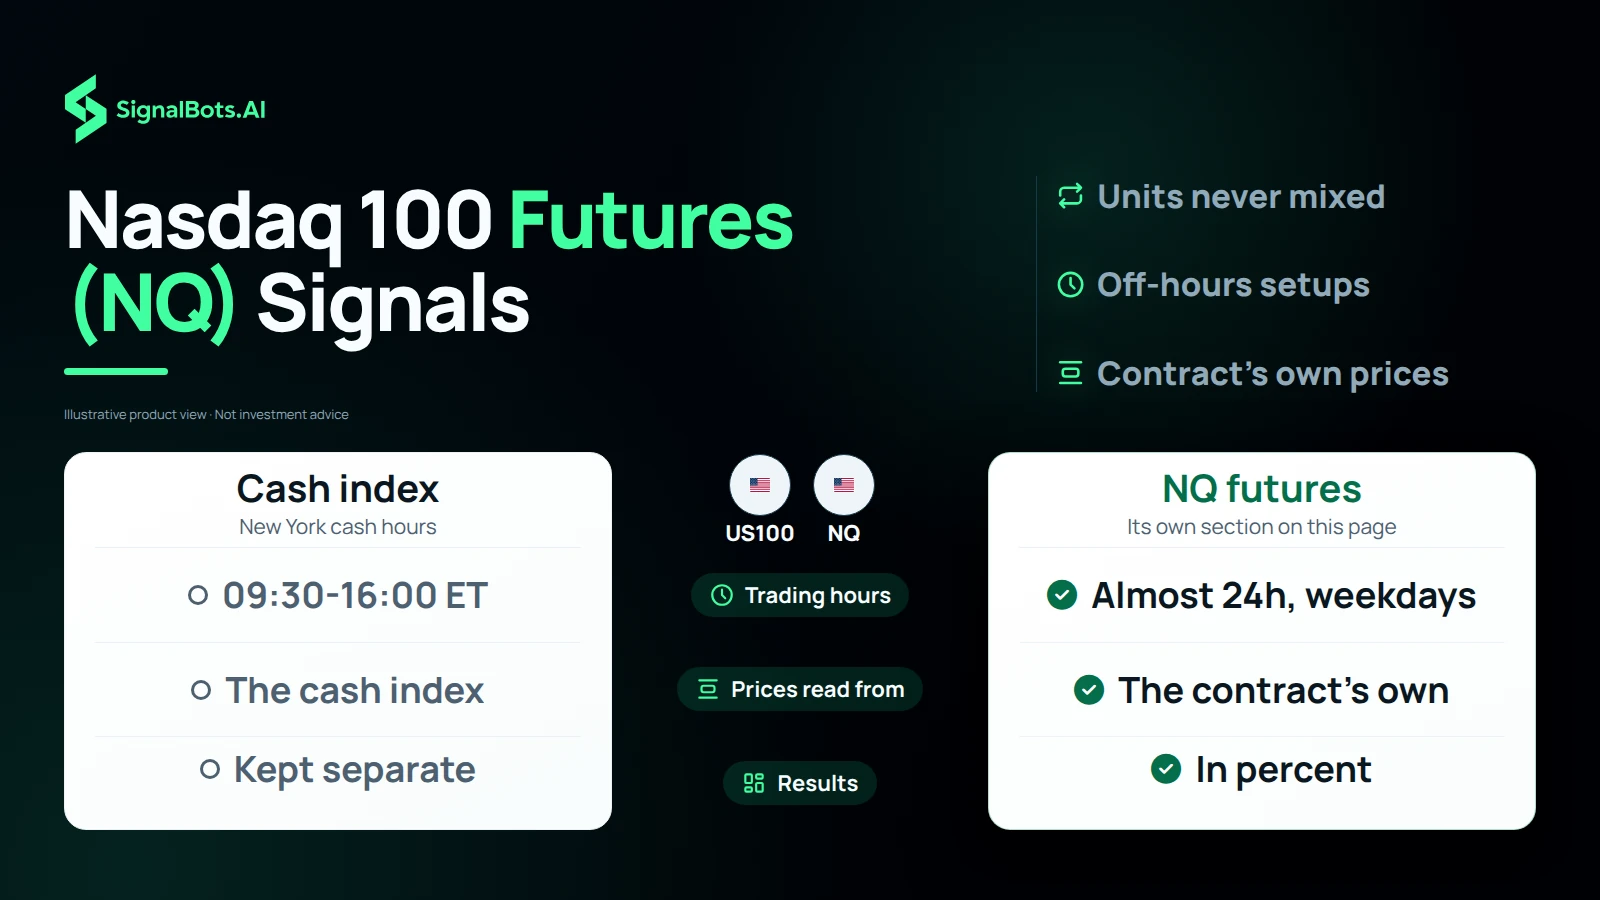
Duotone comparison headlined "Nasdaq 100 Futures (NQ) Signals" with US100 and NQ chips over two panels: the cash index trades 09:30-16:00 ET and reads the cash index, while NQ futures trade almost 24h on weekdays, read the contract's own prices and keep results in percent.

Separate futures section

Nasdaq 100 Futures (NQ) Signals

The CME E-mini Nasdaq-100 futures contract, NQ, is signalled on this page in a separate section. NQ trades almost around the clock on weekdays, so its setups can appear outside New York cash hours, and they are built from the contract's own prices rather than from the cash index. Their results are kept in percentage terms, and US100 binary options signals have a section of their own as well.

Entry discipline

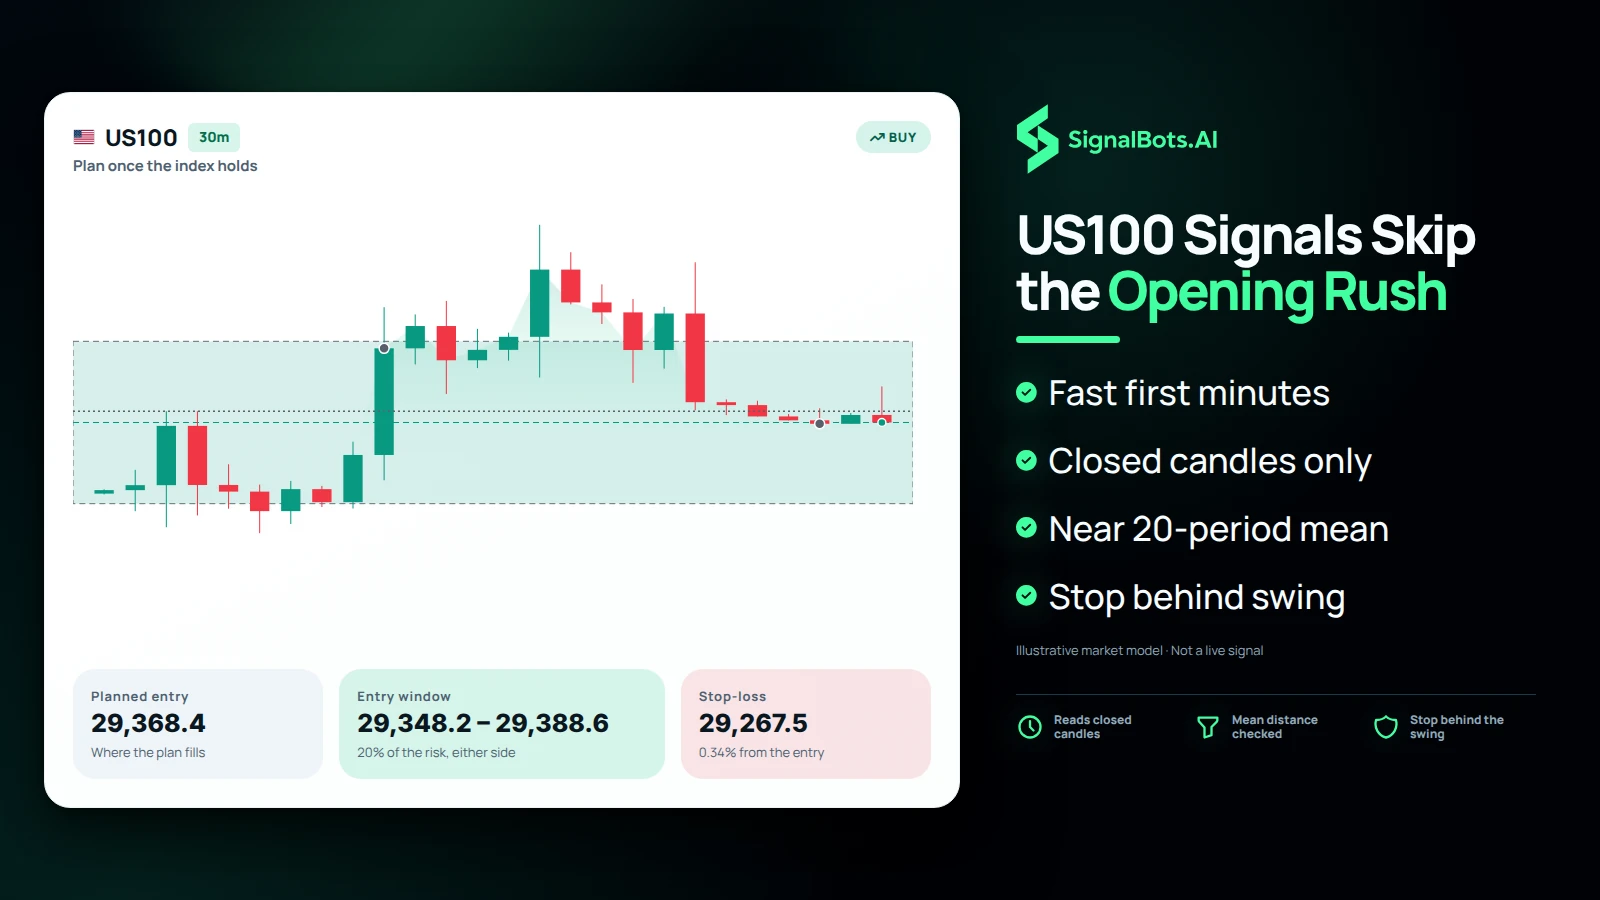
US100 Signals That Skip the Opening Bell Rush

The first minutes after the New York open are often the Nasdaq's most violent. Because signals are read on closed candles and no setup is published while price is stretched more than one average candle from its 20-period mean, a US100 signal is not built from an overextended opening candle. What comes instead is a plan made once the index has shown which way it is holding, with a stop behind the latest swing.

Duotone illustration headlined "US100 Signals Skip the Opening Rush": a US100 30m buy chart titled "Plan once the index holds" shades the entry window, with cards for planned entry, entry window and stop-loss, beside bullets on fast first minutes, closed candles, the 20-period mean and a stop behind the swing.

Win Rate

Wins vs losses
80%
Win Rate

Gain Chart

Cumulative growth over the last 120 days
Past performance is not indicative of future results. US Indices trading carries substantial risk. Review our Risk Warning before subscribing.
ROI Calculator

What if you traded with us?

Move the slider: see the cumulative return our tracked signals produced over the last 7 days, applied to your starting capital.

Starting $1,000
After last 7 days $1,760 +$760
Hypothetical, based on historical Win Rate. Not a guarantee of future returns.
+1959.96%
Total Gain
0.78%
Max Drawdown
+$194460.3
Net Profit
Full Advanced Statistics Click to expand

Advanced Statistics

Updated Oct 29, 2026 · 11:10 GMT
Balance $204460.3
Equity (100.00%) $204460.3
Floating PL $0.0
Deposits $10000.0
Withdrawals $0
Trades 581
Pips 194460300
Won 93%
Avg. Trade Time
Lots 75.53
Profit Factor 127.64
Daily 3.85%
Monthly 115.52%
Trades Per Month 35
Expectancy 6456118.0 Pips / $6456.12
Built for your broker

Keep your broker. Keep your edge.

No switching accounts, no relearning a platform. Whichever forex broker you already trade with, these signals plug straight in. Read them here, or let our extensions, robots and connectors act on them for you.

Trusted by traders

What Nasdaq 100 (US100) Traders Are Saying

A Nasdaq 100 (US100) trade plan I can check before acting

On the US Indices signals page, the Nasdaq 100 (US100) entry, stop and targets give me a defined checklist instead of a rushed decision.

Jack Clarke
Jack Clarke New Zealand

Nasdaq 100 (US100) history makes the process easier to review

I use the US Indices Recent Results and Nasdaq 100 (US100) monthly table to study the setup before I decide whether it fits my own risk plan.

Seo-yeon Choi
Seo-yeon Choi South Korea

Nasdaq 100 (US100) levels help me avoid chasing

Seeing the US Indices Nasdaq 100 (US100) stop alongside the target keeps me patient when price is already moving quickly.

Pieter Nkosi
Pieter Nkosi South Africa

Nasdaq 100 (US100) context without hiding the risk

The US Indices Nasdaq 100 (US100) page makes the outcome history visible, so I can keep position size and risk limits under my own control.

Nurul Wong
Nurul Wong Malaysia

One focused view for Nasdaq 100 (US100)

The US Indices Nasdaq 100 (US100) alerts and symbol filters make it much easier to follow the instruments I actually trade.

Minh Pham
Minh Pham Vietnam

Ready to trade Nasdaq 100 (US100) with us?

Full access to every signal, with instant alerts on the web, Telegram, our extension and mobile app.

No card needed
VIP Access $49/mo · 7-day free trial