Someone types one line — "83% profitable today" — above a date, a currency pair and a link to a spreadsheet. The post circulates. Years later the page itself may not even resolve, but the claim keeps travelling, and eventually it lands in front of you as a search result.
That is the situation here. The nadex cantor exchange binary options signal results march 16 2018 report is a single dated session, published by a third party, headlined as an "83% profitable" day and built around a USD/JPY buy signal. You almost certainly arrived because you found the claim — or a mention of it — and want to know whether the number means anything.
The short version: what survives of that report tells you the direction of one trade and a headline percentage. It does not tell you what the percentage counted, what was paid per contract, or which of the two U.S. exchanges named in the title actually settled the trades. Those three gaps decide whether an "83% day" was a profitable day at all — and they are the same three gaps in almost every dated results post you will ever read.
One thing up front: we did not trade that session, we cannot verify it, and nothing below adopts its numbers as ours. It is an artifact to read carefully. Reading it properly is what teaches you to read the next one.
Key Takeaways
"83% profitable" is a ratio without a denominator: five of six and 83 of 100 print the same headline and mean very different things.
On a contract that settles at $100 or $0, the price you pay is your break-even win rate — an 83% day on $88 contracts still loses money.
Nadex quoted through a dedicated market maker while Cantor Exchange priced off participant liquidity, so the same call could fill, and pay, differently.
One session is a sample, not a record — judge a signal source across many timestamped sessions you can watch accumulate yourself.
Table of Contents (30 min read)Contents
What Happened in the March 16, 2018 Nadex/Cantor Signal Session
Here is what is publicly known, stated at the level it is actually known.
The artifact is a third-party blog post carrying that date, promoted with a headline claiming an "83% profitable" day for its Nadex and Cantor Exchange binary options signals. The body referenced a USD/JPY buy signal, a shared spreadsheet used to log the day's calls, and the author's own note that they were not trading the signals live that morning. The original address no longer serves the page, so what remains in general circulation is the summary line — not the log behind it.
That is the whole evidentiary base: a headline, a pair, a tracking method, and a self-disclosed caveat. Everything else in this article is what you would need on top of that before treating any of it as performance data.
The Headline Claim: An "83% Profitable" Day
A percentage without a denominator is a shape, not a measurement. Five of six is 83%. Ten of twelve is 83%. Eighty-three of one hundred is 83%. The first is a coffee break, the last is a data set, and the headline reads identically for all three.
Four questions a results headline has to survive, and this one answers none of them:
Counted over what? Signals published that day, trades actually taken, or dollars netted?
Measured when? At expiry settlement, or at some favourable moment before it?
Every signal, or the survivors? A log that quietly omits the calls nobody took is a highlight reel.
Settled where? Two exchanges are named in the same breath, and they did not price contracts the same way.
There is also a wording trap worth pausing on. "83% profitable" and "an 83% win rate" are not the same statement, and neither one is "made money". A set of binary contracts can finish 83% in the money and still leave the account smaller than it started — the next section shows exactly how.
The Signal in Focus: A USD/JPY Buy Call
A buy on a binary contract is a call, and a call asserts precisely one thing: at expiry, the underlying is above the strike. Not "trending up". Not "up over the session". Above one number, at one instant.
Everything the price does in between is scenery. A contract can spend most of its life underwater and settle in the money, or ride comfortably in profit for twenty minutes and settle worthless because the final print slipped two pips the wrong way.
How a binary call actually resolves
Illustrative binary call — only the expiry print settles itUSD/JPY5m
Illustrative reconstruction, not the March 2018 session: a call can trade well below its strike for most of its life and still settle in the money, because only the expiry print counts.
Which is why "a USD/JPY buy signal" on its own is a direction, not a trade. Missing from the record: the strike, the expiry time, the price paid for the contract, and how many contracts. Without those, nobody — including the author — can reconstruct what the position earned or lost.
What the Report Actually Supports
It is worth being precise rather than dismissive. Some of the claim is verifiable, some of it simply is not, and the difference is the whole exercise.
Claim vs. evidence
What the report claims
What a reader can verify
What is missing
An "83% profitable" session
That the headline was published under that date
Trade count, what counted as a win, whether every signal was logged
A USD/JPY buy signal
That a directional call on one pair was published
Strike, expiry, contract price paid, number of contracts
Signals tracked in a shared spreadsheet
That a tracking method existed
Whether anyone independent held or timestamped the file
Author was not trading live that morning
The author disclosed it themselves
Whether the logged outcomes were real fills or paper prints
Results for one dated session
The date
The sessions immediately before and after it
The honest audit: the claim is documented, the performance is not. Every row in the third column is something the reader would need before calling this a result.
The disclosed "not trading live" line deserves credit — it is the most transparent sentence in the whole artifact, and most results posts do not include its equivalent. It also quietly reclassifies the report: an untraded log of published calls is a record of signal direction, not of trading outcomes.
Is an 83% Single-Day Win Rate Actually Meaningful?
Two separate questions hide inside that one. First, is the number measuring what it appears to measure? Second, would it prove anything even if it were? A single dated report is one lit slide pulled from a record you never get to see — the sessions around it decide what it means.
Win Rate vs. In-the-Money Count vs. Realized P&L
Three different measurements get reported as if they were one number:
In-the-money count — how many contracts finished on the right side of the strike. A raw count, nothing more.
Win rate — that count divided by the trades actually taken. A ratio, and only as honest as its denominator.
Realized P&L — dollars left after the price paid per contract, exchange and settlement fees, and the orders that never filled.
On an exchange-listed binary that settles at $100 or $0, the third one is governed by something the first two ignore entirely: the price you paid is your break-even win rate. Buy a contract at $65 and you risk $65 to make $35, so 65% of your trades must finish in the money before you are level. Buy the same directional idea at $88 — because the move already happened and the contract is expensive — and you now need 88% just to stand still.
Why entry price sets the bar
Binary payoff at expiry — $65 paid on a $100 contract
━ Call payoff━ Put payoffx-axis: underlying price at expiry • y-axis: P&L per $65 staked
Risk and reward are both bounded, but they are not symmetrical: $65 at stake to win about $35 sets a 65% break-even threshold before a single trade is placed.
Read that against the headline. An 83% session on $65 contracts is a genuinely good day. The identical 83% on $88 contracts is a losing day. Same win rate, same signals, opposite outcome — and a results post that publishes only the percentage cannot tell you which one happened. If you want to see the threshold move as the price changes, run it through the break-even win rate calculator rather than taking anyone's arithmetic on trust.
This is also the cleanest way to separate signal accuracy from realized outcome. Accuracy is a property of the call: was the direction right at expiry? Outcome is a property of your execution: what did you pay, did you get filled, what did the exchange charge. A provider can be entirely honest about the first and still leave you underwater on the second, which is why the payout percentage attached to each trade belongs in any results log that expects to be believed.
None of this is theoretical safety. Binary contracts expire worthless as a normal outcome, and a run of losses is an ordinary feature of the instrument rather than a malfunction — read the full risk warning before treating any published win rate, ours or a third party's, as a reason to trade.
Why One Hot Session Regresses
Now the second question: suppose every number in that post is exactly what it says. Does it prove anything?
Barely. A single session is a sample size small enough that luck dominates. Six trades produce a five-win day roughly as easily as a fair coin produces five heads in six flips — nobody would publish "83% heads today" as evidence of a weighted coin, but the same arithmetic wearing a currency pair somehow reads as skill.
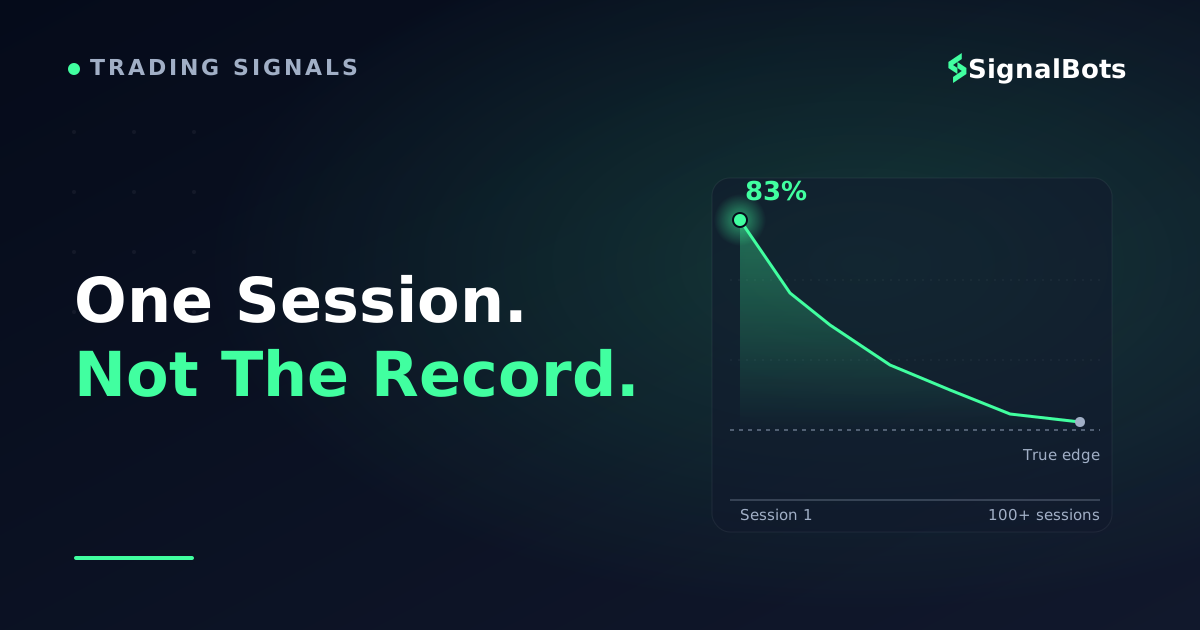
What happens next is mechanical. As sessions accumulate, the running average slides toward whatever the underlying edge actually is, and the opening burst stops mattering:
Sample size in one picture
Illustrative figures, not measured results — the point is the shape, not the values.A hot first session moves the lifetime average a lot and the underlying edge not at all. By session 100 the opening day is noise.
Two further effects push the same way. Selection: hot days get written up, flat ones rarely do, so the dated posts that survive online are the ones that were worth posting — a survivorship bias baked into the archive itself. Ratchet framing: a good session becomes the "proof" screenshot for months, while the sessions around it are never mentioned again.
If you want a feel for how a modest edge behaves across hundreds of trades rather than six, the expectancy calculator does more for your judgment than any single day's headline can — it forces you to state a win rate and a payout together, which is the pair of numbers that decides whether an edge survives.
Why Nadex and Cantor Exchange Can Read Differently for the Same Signal
The query names both exchanges together, and the pairing matters more than it looks. They were not two front doors to the same market.
Where the trade actually settled
Nadex vs Cantor Exchange — as the two were structured
Nadex
Quotes came through a dedicated market maker, so a retail-size order met a standing two-sided price.
Contracts settle at $100 in the money or $0 out — the price paid is the entire risk.
Built for individual retail traders holding accounts on the exchange directly.
Consistent pricing and immediate fills were the exchange's own job.
VS
Cantor Exchange
No dedicated market maker — pricing and depth came from participant liquidity on the book.
Positioned toward platform providers routing flow, rather than direct retail sign-ups.
The price available depended on who else happened to be quoting at that moment.
Same directional call, potentially a different fill and a different payoff.
Two U.S. exchanges, two pricing structures: a results report that does not name the venue has not told you what the trades cost.
Follow the consequence through. On a venue where a market maker is obliged to quote, the contract price a signal-follower pays is broadly predictable, so two people acting on the same alert land close to the same break-even threshold. On a venue where the price comes from whichever liquidity providers are present, the same alert at the same second can cost noticeably more or less — and, as the previous section established, the price paid is the threshold. Identical direction, identical timing, different profitability.
That is why "Nadex and Cantor Exchange results" as a single combined headline is a category error. It merges two different cost structures into one percentage and reports the average of things that should not be averaged.
Two more caveats before you carry any of this forward. Both venues operated as U.S.-regulated designated contract markets, which is checkable in the regulator's own registry rather than on anyone's marketing page — a habit worth keeping for any exchange named in a results claim. And structures are not permanent: Nadex has changed ownership since that date, which is one more reason a 2018 snapshot describes a market that no longer exists in the same form.
A Checklist for Judging Any Dated Signal Results Report
You will meet more of these. A dated post, a percentage, sometimes a spreadsheet — the format is durable because it is cheap to produce. Rather than re-litigating each one, run it through the same filter.
Portable filter
Before you treat a dated results post as evidence
0 / 9
The denominator is stated: how many signals were issued, and how many were actually traded.
Win and loss are defined at settlement, not at a favourable mid-trade moment.
Every signal from the period is logged — including the ones nobody took.
Entry prices are recorded per contract, not just the direction and the outcome.
The exchange or broker is named, so the cost structure behind the fills is knowable.
Fees and settlement charges are inside the reported figure, not excluded from it.
The log says plainly whether the trades were live or paper.
The sessions before and after the highlighted day are published too.
Someone other than the author can inspect or timestamp the record.
★
Checklist complete — you’re cleared to proceed.
A dated post that clears fewer than half of these is a marketing artifact, not a performance record — regardless of how large the percentage is.
Two failure modes are worth naming explicitly, because they are common and neither one requires dishonesty. The first is retrofitting: a record assembled after the fact from memory or from charts, rather than logged as the trades happened — backdating a track record can look immaculate precisely because nothing was at stake while it was written. The second is unverifiable custody: a spreadsheet the author can edit at will is not a verified track record, no matter how detailed it is, because nobody else can prove what it said yesterday.
Apply the same filter to any signal provider that ships a results screen — the numbers inside a free binary options signal app or a downloadable signal tool are self-reported in exactly the same way a blog post is, and deserve exactly the same denominator question.
Where to Watch Live Binary Signals Instead of a Single Archived Day
Every problem above has one structural fix: stop judging a source from a frozen artifact and start watching it accumulate.
That is the job our binary options live signals feed is built for. Each signal appears as it is issued, with its direction, instrument and expiry visible at the moment of publication rather than summarized afterwards — so the denominator question answers itself. You see the calls that worked and the calls that did not, in the order they happened, and you can run your own tally against the entry prices your own platform quotes you. Take the checklist above and point it at us: the whole value of a live feed is that it cannot quietly drop a bad session from the record.
Be clear about what it is not. It is a feed to watch and evaluate, not a broker, and not a retroactive audit of the March 2018 claim or of any other archived report. If you are set specifically on trading U.S. exchange binaries, you will still want a roundup of ongoing Nadex signal services alongside it — this page reviews one dated report, it does not rank providers.
Bottom Line: One Good Session Proves Very Little
Return to where you started: a line of text, a date, a percentage. What can you now say about it?
That an "83% profitable" day was claimed for a set of Nadex and Cantor Exchange signals, that one USD/JPY buy call was mentioned, and that the author was transparent enough to say they were not trading it live. That is the honest extent of it. What the percentage counted, what each contract cost, which exchange settled it, and what the surrounding sessions looked like are all unknown — and each one of them can flip an 83% day from a good result to a losing one.
None of that makes the original post dishonest. It makes it thin, in exactly the way single-session reports are always thin. The useful move is not to argue with a seven-year-old spreadsheet; it is to stop accepting frozen snapshots as evidence and start judging any signal source the way it is actually experienced — session after session, with the entry prices attached, over a sample long enough that one hot morning cannot carry the story.
FAQ
Can I still read the original March 16, 2018 results post?
Not at its original address — the page no longer serves, and no public archive copy surfaced when we looked. What circulates is the summary line: the headline claim, the USD/JPY buy signal, and the mention of a shared spreadsheet. Treat any version you find elsewhere as a copy of the headline rather than the underlying log, and apply the checklist above to it.
Does an "83% profitable" day mean the signals made money?
Not necessarily, and that is the central point. On contracts that settle at $100 or $0, the price paid sets the break-even threshold: 83% wins is comfortably positive on cheap contracts and negative on expensive ones. Without entry prices and fees, a win-rate headline cannot tell you which side of that line the session landed on.
Are Nadex and Cantor Exchange the same thing?
No. Both operated as U.S.-regulated exchanges offering binary contracts, but Nadex quoted through a dedicated market maker aimed at retail traders, while Cantor Exchange priced from participant liquidity and was oriented toward platform providers. Same direction, potentially different fill and different payoff — which is why a combined results figure blurs two different cost structures.
Did SignalBots trade or verify that session?
No. We did not place those trades, we hold no copy of the spreadsheet, and we make no claim about whether the reported outcomes occurred. This article reviews a third-party report as an artifact — the analysis is ours, the numbers are theirs and remain unverified.
How many sessions before a signal record actually means something?
There is no clean threshold, but the useful test is stability rather than count: keep watching until one strong or weak session stops visibly moving the running average, and until the record spans different market conditions — quiet ranges, news-driven volatility, and thin sessions. A record that only covers favourable conditions is a short sample wearing a long timeline.
Sources & Further Reading
Want to go deeper? These independent, authoritative sources shaped this guide — each one is worth reading in full:
The Binary Options Desk is the SignalBots editorial team for fixed-time and OTC trading coverage. We research and write the guides that explain expiry timing, payout structure and disciplined entry across the major brokers.




Discussions 0
Leave a comment