You marked the demand zone. Price came back into it. You bought a call — and then watched ninety seconds of sideways drift until the contract expired two pips on the wrong side of your entry. Forty minutes later price was well above the zone. The zone worked. Your contract had already been settled.
That is not a zone problem. It is a translation problem. Almost everything written about supply and demand assumes an open-ended position with a stop-loss underneath doing the arguing for you. A binary contract gives you neither. You choose a direction and a deadline, and the deadline belongs to the platform, not to the market.
So the strategy has to be rebuilt on top of the general binary options signal strategy playbook to produce two answers instead of one: which way, and for how long. What follows is the full chain — how to qualify and mark a zone on a 1- to 15-minute chart, the exact retest event that turns it into an actionable trigger, how to convert the zone's own geometry into an expiry length, when to declare a zone dead, and how to size a trade whose only stop-loss is the stake itself.
Key Takeaways
A zone answers direction only; the zone's timeframe, the distance to the next obstacle and the current candle range answer duration — read both off the same screen before you click.
Enter at the open of the candle after a confirmation candle closes (rejection wick, engulfing close, or micro structure shift), never on the touch itself.
The first retest is the trade: a third touch, a body close beyond the distal edge, or a session handover retires the zone.
With no stop-loss, the stake is the risk — size a fixed fraction, keep the payout's break-even win rate in view, and never escalate after a loss.
Table of Contents (39 min read)Contents
What Is a Supply and Demand Zone in Binary Options Trading?
A supply and demand zone is a price area — not a line — where a stretch of quiet trading was followed by an unusually forceful move away from it. The quiet part is the base: a small cluster of candles where buyers and sellers were briefly in balance. The forceful part is the departure: the candle or short run of candles that abandoned that balance.
The area matters later because a market that leaves in a hurry leaves business unfinished. Orders that wanted to transact at those prices never got the chance, and when price returns, that unfinished business is what produces the reaction you are trying to trade. A base beneath a sharp rally is a demand zone. A base above a sharp sell-off is a supply zone.
Two neighbours are worth separating out. A support or resistance line is a single price that has been touched repeatedly over time; a zone is a band defined once, by the way price left it, and it is at its best before anyone has touched it. An order block is the smart-money-concepts cousin: narrower, defined by the single last opposing candle before a displacement rather than by a multi-candle base. The workflow below applies to all three, but the marking rules are written for the base-and-departure version.
Here is the part that generic zone material never handles. A binary options signal has to carry a direction and an expiry, and a zone by itself only answers the first. Treat zone-based binary options signals as a three-part condition, all of which must be true before you click:
A qualified zone — the right shape, and fresh enough to still be worth something.
A confirmed retest — a specific candle event inside the zone, not simply a touch.
A matched expiry — a contract length derived from the zone's timeframe and the market's current speed.
Miss the third and you can be right about the market and still finish out of the money. Most of the losses that feel unfair come from exactly there.
The signal, in three reads
Three Reads, One Signal
1
Qualify the zone
Mark the base and departure on the signal chart; confirm it is fresh, correctly sized and not blocked by a higher-timeframe level.
2
Confirm the retest
Wait for a rejection wick, an engulfing close or a micro structure shift on the trigger chart — never a bare touch.
3
Match the expiry
Derive the contract length from the zone's timeframe, the distance to the next obstacle and the market's current candle range.
Direction, trigger, deadline — a zone by itself only ever answers the first one.
How to Mark a Supply and Demand Zone on a Short-Duration Chart
Work with two charts, not one. The signal chart is where zones are marked and qualified; the trigger chart is where the entry is timed. A useful ratio is roughly one to five up to one to fifteen — mark on 15 minutes and trigger on 1 minute, mark on 5 minutes and trigger on 30 seconds, mark on 1 hour and trigger on 5 minutes. Anything closer than that and the two charts tell you the same thing twice; anything wider and the trigger chart shows noise the zone never cared about. This is ordinary multi-timeframe confirmation, tightened down to binary-relevant intervals.
Then mark in this order:
Find the departure first, not the base. Scan the last few hours right to left and look for the steepest, cleanest move on the chart. Bases are hard to see; violent moves are not. The base is wherever that move started.
Walk back to the origin. Step left from the first big candle until the candles go small again. That cluster is your base.
Qualify the base. One to five candles, bodies visibly smaller than the departure candle that follows, ideally with at least one candle whose body is small relative to its whole range. A twelve-candle sideways drift is a range, not a base — ranges get broken, bases get defended.
Qualify the departure. It should travel at least two to three times the height of the base, and it should take out the previous swing point in its direction — a break of structure tells you the move was decisive rather than a bounce inside a range. Departures that leave visible gaps between candle wicks are the strongest kind.
Draw the two edges (see below) and extend the box to the right until price returns to it.
Cap what is on the screen. Two or three live zones per side. A fast chart wearing eight boxes has stopped being a signal and become wallpaper.
Write down the zone's height in pips or points. That single number does more work later than anything else you have marked, because it feeds directly into the expiry decision.
The Four Zone Patterns and Which Suit Short Expiries
Every zone is one of four shapes, named for what price did before the base and after it:
Rally-Base-Rally — continuation demand. Price paused inside an advance and then continued.
Drop-Base-Drop — continuation supply. The mirror image inside a decline.
Drop-Base-Rally — reversal demand. Price fell into the base and left upward.
Rally-Base-Drop — reversal supply. Price rose into the base and left downward.
For fixed expiries the distinction is not academic. Continuation zones that agree with the prevailing direction tend to react quickly — the market is not being asked to change its mind, only to resume — so the time from touch to reaction is short and a tighter expiry is defensible. Reversal zones ask more of the market and frequently spend several candles deciding, which is precisely where traders who chose a two-minute contract lose a trade that a five-minute contract would have won. When you trade a reversal zone, budget more time or trade a smaller stake, not the other way round.
Proximal and Distal: Where the Two Edges Go
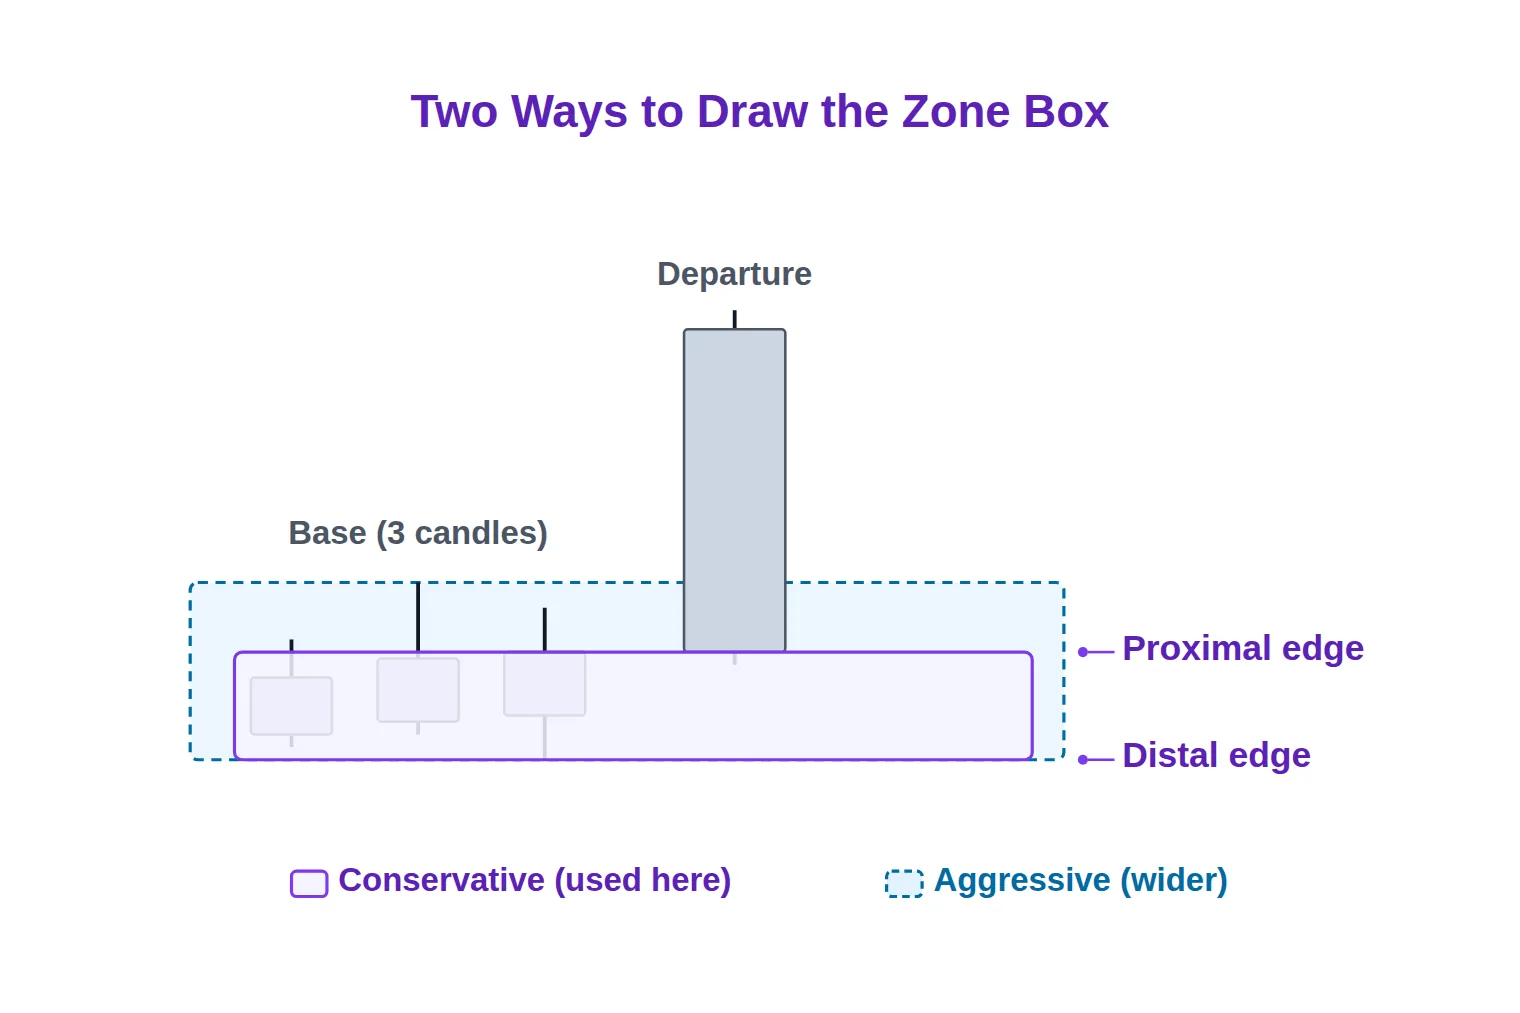
Every zone has a proximal edge — the side price meets first on its way back — and a distal edge, the far side. For a demand zone the proximal edge sits at the top of the base and the distal edge at the lowest wick; for supply it is reversed.
The conservative convention puts the proximal edge at the extreme of the candle bodies and the distal edge at the extreme of the wicks. The aggressive convention uses wicks for both, producing a wider box that price enters earlier. Wider is not automatically better on a binary chart: a wide zone gets touched sooner and more often, which means more entries that were never really defended. Draw the proximal edge at the body extreme, keep the distal edge at the wick, and let the trigger chart — not the zone boundary — decide when you actually enter.
Proximal at the bodies, distal at the wick: the box this strategy uses, next to the wider aggressive box it deliberately avoids.
One more filter before a zone earns a place on the list: check the timeframe one degree above your signal chart. A five-minute demand zone sitting directly beneath an untouched one-hour supply zone is a long trade into a wall. Skip it, or halve the expiry you would otherwise have chosen.
If you would rather watch the marking than read it, this walkthrough draws zones candle by candle on a live chart and shows the mis-draws that make a zone useless.
How To Draw Supply And Demand Zones Correctly — Mind Math Money
Marking by hand is how the strategy gets learned, but staring at charts is not how it gets traded. Once your rules are stable, set platform price alerts at the proximal edge of each live zone so the chart calls you instead of the other way round, and let a screener carry the job of watching several symbols at once. Alerts handle attention; the qualification rules above still have to be yours.
To build the reps quickly, replay history instead of waiting for it. Practising with bar replay lets you step through a past session one candle at a time, mark zones before you can see what happened next, and find out within minutes whether your marking rules survive contact with a real chart.
Reading the Retest: The Candle Confirmation That Triggers a Signal
There are only two ways to get the retest wrong, and they are opposite errors with a single cause.
Too early is entering the moment price touches the proximal edge. Zones are areas, and price routinely trades through most of one before turning; a touch entry regularly puts you in several pips above where the reaction actually begins, which on a fixed-payout contract is pure loss of cushion. Too late is entering after a large reaction candle has already closed. By then the fast part of the move is behind you, your entry price sits high inside it, and the contract needs the market to keep going rather than merely to hold.
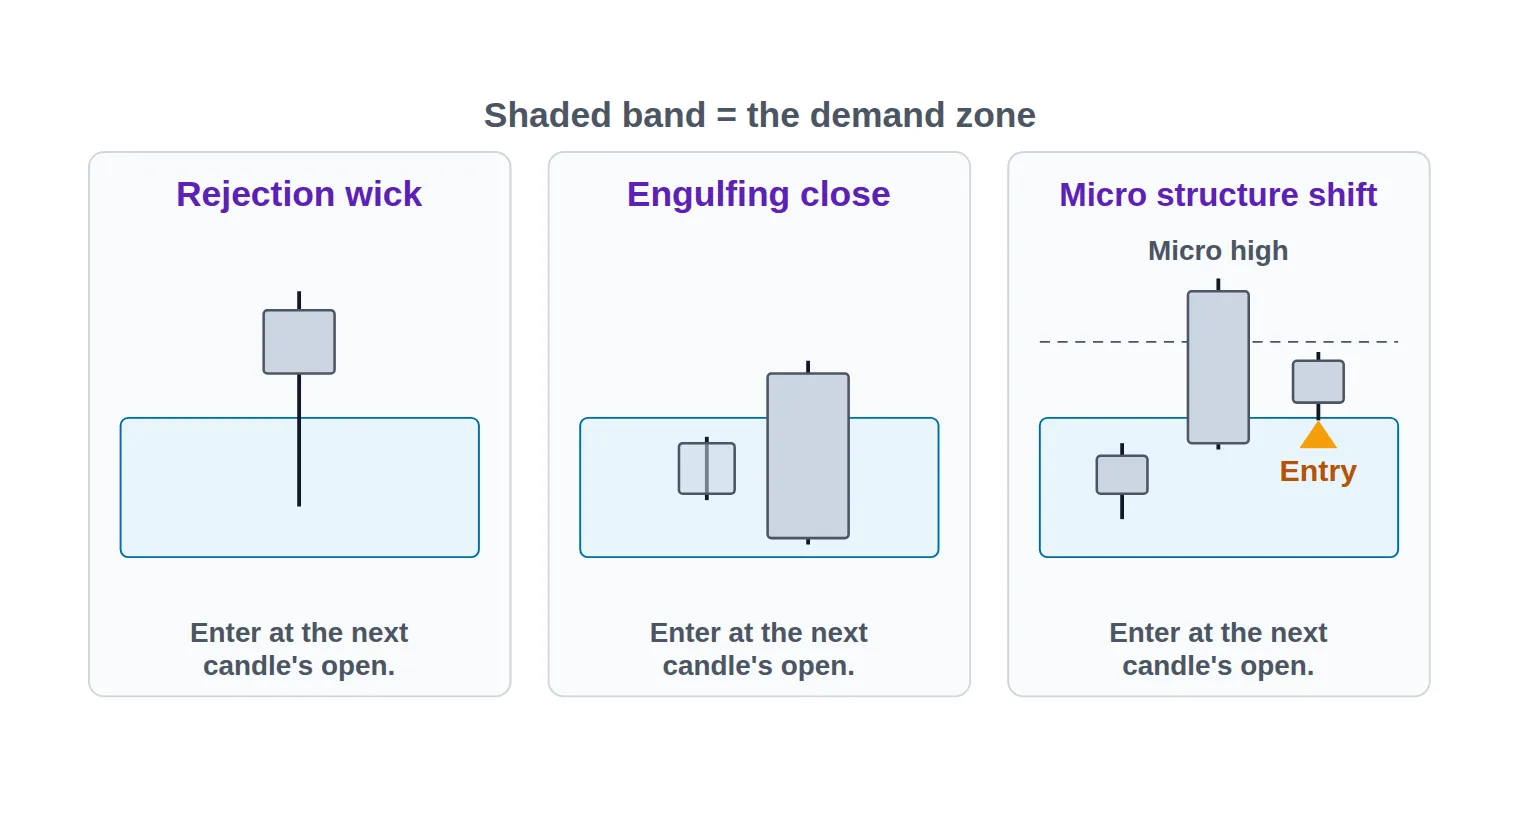
The cause of both is the same: no defined trigger. So define one. Price must be inside the zone, and the trigger chart must print a confirmation candle matching one of exactly three patterns:
Rejection wick. A candle whose wick pushes into the zone at least about twice the length of its own body, with the body closing back outside the proximal edge. The market went there, found the price unacceptable, and came back within a single candle.
Engulfing close. A candle that closes beyond the previous candle's body in the zone's direction, finishing on the correct side of proximal. Slower than a wick rejection but often more reliable on reversal zones.
Micro structure shift. Price makes its low (or high) inside the zone, then takes out the most recent micro swing in the opposite direction on the trigger chart. Enter on the first pullback that holds the proximal edge rather than on the break itself.
Rejection wick, engulfing close, or micro structure shift — the only three candle events that turn a touch into a trigger.
Then the rule that matters most for a fixed-expiry instrument: enter at the open of the candle after the confirmation candle closes. Not mid-candle, not on the wick as it forms. Two reasons. The first is honesty — a rejection wick is only a rejection once the candle has closed, and half the wicks that look like rejections at second forty are ordinary bodies by second sixty. The second is arithmetic: entering at a candle open puts your expiry clock in phase with the candle clock, so a three-minute contract on a one-minute trigger chart expires at a candle boundary you can actually watch approaching, instead of somewhere inside a candle whose shape you cannot yet see.
Two extra tests before you commit. First, the room test: if the confirmation candle is enormous relative to the recent candles around it, the easy part of the reaction is already spent and your entry price has been dragged deep into the move — skip it, or wait for the pullback entry. Second, the character test: a retest that arrives as one violent candle slicing through both edges and closing back inside is more likely a liquidity sweep than a defence, and it deserves an extra candle of patience. A retest that grinds sideways inside the zone for many candles is telling you the imbalance is being absorbed rather than defended — that zone is being consumed in front of you, and the right response is to remove it from the chart, not to keep waiting for the bounce.
How Long Should the Expiry Be?
This is the step no swing-oriented zone guide can help you with, because in every other instrument the answer is "however long it takes."
Three inputs decide the expiry time, and you can read all three off the charts already in front of you.
Input one: the zone's timeframe. A zone marked on a 15-minute chart describes a decision made over 15-minute intervals, and its reaction is measured in those units, not in seconds. The rule of thumb underneath it is worth memorising: aim for roughly three to five candles of the trigger chart, and rarely more than one and a half candles of the signal chart. The table below turns that into a starting band for each of the three common chart pairings — a calibration to be adjusted by inputs two and three, never applied as a law.
Zone timeframe → expiry
Signal chart
Trigger chart
Expiry band
5-minute
30-second
1–3 minutes
15-minute
1-minute
3–5 minutes
1-hour
5-minute
15–30 minutes
The starting calibration — adjust with the distance to the next obstacle and the market's current speed before you round to a rung.
Those bands are where the decision starts, not where it ends. The next two inputs are what move you around inside them.
Input two: the distance to the first obstacle. Measure from your entry to the nearest thing that can stop the move — the previous swing point, an opposing zone, a round number. If that distance is small, a longer expiry does not help you; it only gives price time to reach the obstacle, stall, and come back through your entry.
Input three: the market's current speed. Eyeball the recent average candle range on the trigger chart, or read it off an average true range indicator. Divide the distance from input two by that average range and you have the number of candles the market needs at today's pace. A quiet pre-session hour and a live session open produce completely different answers from the same zone, which is exactly why a fixed personal rule like "always three minutes" fails in the wrong week.
Combine them like this: take the candle count from input three, cap it with input one, add a buffer of a candle or two for the reaction to start, and round up to the platform's next available rung. Expiry ladders are discrete — if your calculation says four minutes and the ladder offers three or five, take five. And check whether the rung is a duration or a deadline; picking "end of hour" with eleven minutes left on the clock is not a five-minute trade no matter what you intended.
Now the asymmetry that changes how you should think about all of this. On a high-low style call or put contract you do not need price to reach a target. You need it to be on the correct side of your entry price at one specific instant, which is what puts the contract in the money. So the expiry should land while the reaction is still developing — not after it has had time to complete, stall and round-trip. Traders assume their expiries are too short. In zone trading they are more often too long: long enough for the zone to fail, or for the bounce to be given back, when a shorter contract would have settled at the strongest part of the move.
Two guardrails complete the picture. Never let a contract straddle a scheduled release — check the economic calendar before choosing a rung, because a zone's memory does not survive a data print. And avoid expiries that land in the first minutes after a session handover, when the spread and the candle range both change character mid-contract.
When a Zone Is No Longer Valid
Binary trading has no stop-loss to remove you from a broken idea, so invalidation has to be decided before the entry and applied as a filter rather than an exit. Six checks retire a zone.
A close beyond the distal edge. Not a wick through it — a candle body closing past the far side on the signal chart. That is the hard invalidation, the event a stop-loss would have handled in any other instrument. Once it happens, delete the box; do not "give it one more test."
Touch count. The first retest is the trade the whole method is built around, because the unfilled orders that made the zone are still unfilled. A second touch is tradable only with a stronger confirmation and a shorter expiry. By the third, treat the zone as consumed and expect a break rather than a bounce.
Penetration depth. Count how deep the last visit went, not just that it happened. A prior touch that pushed past the middle of the zone consumed most of what was there, so treat the next visit as third-touch quality even if the wick technically respected the distal edge.
Session decay. On fast charts, age is measured in sessions rather than days. A five-minute zone built during the Asian session describes a market that no longer exists once London is trading. After a session handover, demote every intraday zone: trade it only if a higher-timeframe zone or level sits on top of it and vouches for the area.
Structure change. If the market has broken structure the other way since the zone formed, your demand zone is now a counter-trend trade wearing a continuation label. Either accept the lower quality with a smaller stake, or leave it.
Feed change. On weekend and after-hours symbols the price series is produced by the platform rather than the interbank market. Zones still form and are still respected inside an OTC market feed, but do not carry a weekday zone into an OTC session or the reverse. Different feed, different memory.
Before any entry, run all six as one quick pass, answered from the chart in front of you rather than from memory.
Pre-entry check
Before You Click: Six Zone Checks
0 / 6
No candle body has closed beyond the distal edge.
Price has returned to the zone once, twice at most — a third touch is a break candidate, not a bounce.
The last visit stayed shallow — it did not push past the zone's midpoint.
The zone was born in the current session, or a higher-timeframe zone or level backs it up.
Market structure still agrees with the zone's direction since it formed.
No scheduled economic release falls inside the expiry window you are about to choose.
★
Checklist complete — you’re cleared to proceed.
One trade-worthy answer per question — a single fail retires the zone.
Worked Example: From Marked Zone to Placed Trade
The prices below are illustrative — a composite of how the workflow runs, not a record of a specific trade.
Suppose you are watching EUR/USD an hour before the London session. On the 15-minute signal chart, you find a sharp rally that broke the prior swing high, and you walk back to its origin: three small candles between 1.0840 and 1.0848. That is a drop-base-rally demand zone, eight pips tall. The departure travelled roughly thirty-five pips, comfortably more than three times the base height, and the zone has not been touched since it formed earlier in the same session.
You draw the proximal edge at 1.0848 (the top of the bodies), the distal edge at 1.0840 (the lowest wick), extend the box right, and note the height: eight pips.
Price drifts back down through the morning. When it enters the box you switch to the 1-minute trigger chart and stop looking at the 15-minute entirely — its job is done. Price ticks to 1.0846, then 1.0842, wicks to 1.0841, and closes at 1.0847. That is a rejection wick: the wick is roughly twice the body, it reached deep into the zone, and the body closed back above the proximal edge.
Now the expiry. The nearest obstacle above is the previous swing high near 1.0862, about fifteen pips from your likely entry. Recent 1-minute candles have been running about one and a half pips of range, so a full run to that swing would need roughly ten candles — too far to demand. But a high-low contract does not need the swing high; it needs to be above the entry price at expiry. The reaction off a fresh demand zone that agrees with the prevailing direction usually shows itself within the first two to four candles, so you take that window, add a buffer, and choose the three-minute rung — well inside the 3-to-5-minute band the 15-minute zone suggests, shortened because the market is quiet and the obstacle is close.
You place a call at the open of the next 1-minute candle, at 1.0848, staking your usual fixed fraction. Your invalidation was decided before the click: if a 1-minute body closes below 1.0840, the zone is gone and there is no re-entry on that box today.
Worked example
EUR/USD — demand zone retest on the 1-minute trigger chartEUR/USD1m
A fresh demand zone, a confirmed rejection wick, and a 3-minute expiry chosen for the reaction already under way — not for the swing high it may never reach.
The whole method on one screen: the zone, the rejection wick that confirms it, and the entry — no stop-loss line, because the stake is the stop-loss.
The instructive part is the branches you did not take. Had that rejection candle closed at 1.0856 instead — a huge candle, most of the reaction already delivered — you would have skipped it on the room test. Had the zone already been visited twice that morning, you would have skipped it on touch count. Had a data release been scheduled inside those three minutes, you would have waited for the release and re-qualified the zone afterwards. And if price had spent six 1-minute candles wandering inside the box without a confirmation, the correct action was to erase it, not to lower the standard.
Sizing the Trade and Managing Risk Without a Stop-Loss
In a binary contract, the trade stake is the stop-loss. There is no partial loss, no moving to break-even, no trailing exit — the position resolves at its deadline, fully won or fully lost. That single fact rewrites the risk chapter every zone guide gives you.
It also fixes your reward-to-risk ratio before you click. In spot trading you improve that ratio by managing the trade; here it is set by the platform's payout percentage and nothing you do afterwards can change it. The only two levers you own are the quality of the entry and the discipline to pass on marginal setups.
Understand what the payout demands of you arithmetically. If a winner returns 80% of your stake and a loser costs 100% of it, you need roughly five winners in every nine trades just to stand still — the break-even win rate is above half by construction, and it climbs as the payout falls. Run your platform's real payout for your real symbols through the break-even win rate calculator before you decide whether a class of setup is worth trading at all.
That arithmetic is why the freshness rules earlier are risk management rather than aesthetics. Third-touch zones and unconfirmed touches are exactly how a historical win rate that comfortably cleared break-even drifts quietly below it, one "close enough" entry at a time. Selectivity is not a personality trait in this instrument; it is the only variable on your side of the payout equation.
Practically, that means:
Stake a fixed small fraction of the account per contract and recalculate it weekly, not after every result. A money-management calculator will show you how quickly a stake that feels modest becomes immodest across a losing run.
Never escalate after a loss. Martingale staking is uniquely hostile in fixed-payout trading: because a win returns less than the stake, each recovery step has to grow faster than the payout that repays it, and the sequence needed to wipe an account is shorter than it feels.
Treat correlated pairs as one position. A demand zone on EUR/USD and a demand zone on EUR/GBP at the same hour are usually one euro story; two contracts is one bet at double stake.
Set a session floor. Decide a daily loss limit in advance — a number of losses, not a feeling — and stop when it is hit. Zone quality degrades late in a session; your patience degrades faster.
Use early close deliberately, not emotionally. Where a platform offers early close, it is the closest thing this instrument has to a stop-loss. Use it when your written invalidation fires before expiry, never to escape ordinary noise inside the zone.
None of this makes a fixed-payout instrument safe. Before you trade any of it live, read our risk warning and size for the losing streak, not for the example above.
See Zone-Based Setups on Live Binary Signals
Once the workflow is yours, the fastest way to sharpen it is to compare your read against setups someone else has flagged in real time. Our live binary options signals feed publishes real-time buy and sell calls with their reward-to-risk context, free to view.
Use it as a mirror rather than a shortcut. When a call appears on a pair you follow, open your own chart first: mark the zone, decide which of the three confirmations you would require, choose the expiry rung the zone's timeframe and the current candle range imply — and only then look at what the feed says. The places where you disagree are the places your rules are still vague, which is far more useful information than a signal you simply copied.
The boundary is worth stating plainly: the feed surfaces flagged setups; it does not do your zone marking or your expiry judgement for you. If you are still learning to tell a fresh zone from a consumed one, verify the level yourself before treating any live signal as confirmation.
The Workflow in One Pass
Run it in the same order every time, and the strategy stops depending on how you feel that morning:
On the signal chart, find the steepest departure, walk back to its base, qualify both, and draw the box — proximal at the bodies, distal at the wicks.
Retire anything that fails the six invalidation checks before it ever becomes a candidate.
When price enters a surviving zone, switch to the trigger chart and wait for a rejection wick, an engulfing close, or a micro structure shift.
Enter at the open of the following candle.
Set the expiry from the zone's timeframe, the distance to the first obstacle, and the current candle range — rounded up to the next rung, short enough to settle while the reaction is still running.
Stake your fixed fraction and let the contract resolve.
The zone told you where the market is likely to react. The chart in front of you tells you how long that reaction needs. Supply and demand zone trading in binary options only works when you take both readings from the same screen.
FAQ
What timeframe should I mark zones on for a five-minute expiry?
Work backwards from the expiry. Five minutes should cover roughly three to five candles of your trigger chart, which points to a 1-minute trigger and a 15-minute signal chart. Marking a five-minute expiry off a 1-hour zone is a mismatch: the zone may be perfectly valid and still take half an hour to do anything, which is a losing contract with a correct thesis.
Should I enter as soon as price touches the zone?
No. A zone is an area and price frequently trades most of the way through one before reacting, so a touch entry usually costs you cushion you cannot recover in a fixed-payout contract. Wait for a confirmation candle to close on the trigger chart, then enter at the next candle's open — that single rule fixes both the too-early and the too-late failure modes.
How many retests before a supply or demand zone stops being tradable?
Trade the first retest by default, the second only with stronger confirmation and a shorter expiry, and treat the third as a break candidate rather than a bounce. Depth matters as much as count: a single visit that pushed past the middle of the zone has already consumed most of it, so grade the next visit as though two touches had happened.
Do supply and demand zones work on weekend OTC binary markets?
Zones form and are respected on OTC feeds, because the same mechanics of imbalance and continuation are modelled there. The rule to keep is that zones do not travel across feeds: mark OTC zones on OTC charts during OTC hours, and start a fresh set when the weekday market reopens. Mixing the two gives you levels the current price series has never seen.
Can I automate zone detection instead of drawing them by hand?
Detection, yes; qualification, mostly not. A scanner or indicator will find bases and departures across a watchlist far faster than you can and will alert you when price re-enters one, which solves the real problem of having to watch several symbols at once. What still needs your judgement is freshness, structural agreement and the expiry decision — the three things that separate a marked rectangle from a tradable signal. Automate the attention, keep the qualification.
Is a supply and demand zone the same thing as an order block?
They overlap but are drawn differently. A supply and demand zone is defined by a multi-candle base plus the move that left it; an order block is defined by the single last opposing candle before a displacement. In practice an order block often sits inside the demand or supply zone you would have drawn, which makes it a useful way to tighten an entry — but the freshness, expiry and invalidation rules in this article apply the same way to both.
Sources & Further Reading
Want to go deeper? These independent, authoritative sources shaped this guide — each one is worth reading in full:
The Binary Options Desk is the SignalBots editorial team for fixed-time and OTC trading coverage. We research and write the guides that explain expiry timing, payout structure and disciplined entry across the major brokers.



Discussions 0
Leave a comment