Forex Signals

AUD/USD Trading Signals

Real-time AUD/USD signals with a full trade plan: entry, stop-loss, and take-profit targets, delivered in under 10ms on the web, Telegram, our browser extension and mobile app.

Live Signals
LIVE Last AUD/USD signal 0 active now
Performance

Recent Results: Forex

Per-symbol net pip outcome by day across the last 30 trading sessions. Filter to a symbol to isolate its track.

Monthly Summary: Forex Click to toggle
Month, Year Total (Pips) AUD/USD
Month-to-date 980.0 980.0
September 2026 860.0 860.0
August 2026 500.0 500.0
July 2026 145.0 145.0
June 2026 480.0 480.0

Disclaimer: Past performance does not guarantee future results, and the results shown here represent historical outcomes only and may not be repeated. Please trade and invest with caution; the information provided is for informational purposes only and does not constitute investment or trading advice.

Direction
Get every AUD/USD signal instantly Web, Telegram, browser extension, and mobile app, all included on any plan.
AUD/USD 5 Minutes
Sell
Entry 0.70433
Stop Loss 0.70469
TP1 0.70397
TP2 0.70360
TP3 0.70324
TP4 0.70287
Loss #130278
AUD/USD 30 Minutes
Buy
Entry 0.70497
Stop Loss 0.70426
TP1 0.70568
TP2 0.70640
TP3 0.70711
TP4 0.70782
TP2 Hit #130216
AUD/USD 1 Minute
Buy
Entry 0.70545
Stop Loss 0.70536
TP1 0.70554
TP2 0.70564
TP3 0.70573
TP4 0.70583
TP1 Hit #130211
AUD/USD 1 Hour
Buy
Entry 0.70344
Stop Loss 0.70225
TP1 0.70463
TP2 0.70583
TP3 0.70702
TP4 0.70821
TP2 Hit #130112
AUD/USD 1 Minute
Sell
Entry 0.70345
Stop Loss 0.70359
TP1 0.70331
TP2 0.70317
TP3 0.70303
TP4 0.70289
TP4 Hit #130016
AUD/USD 1 Hour
Buy
Entry 0.70289
Stop Loss 0.70219
TP1 0.70359
TP2 0.70428
TP3 0.70498
TP4 0.70567
TP4 Hit #129943
AUD/USD 1 Hour
Buy
Entry 0.70246
Stop Loss 0.70086
TP1 0.70406
TP2 0.70566
TP3 0.70726
TP4 0.70886
TP2 Hit #129799
AUD/USD 4 Hours
Sell
Entry 0.70164
Stop Loss 0.70421
TP1 0.69907
TP2 0.69650
TP3 0.69394
TP4 0.69137
Loss #129775
AUD/USD 1 Hour
Buy
Entry 0.70288
Stop Loss 0.70221
TP1 0.70355
TP2 0.70422
TP3 0.70489
TP4 0.70556
Loss #129596
Trade Ledger

Last 20 Signals: Forex

Date, time Order Price Take Profit Stop Loss State Entry Exit Profit
October 29, 2026 at 8:00 AM GMT Oct 29, 26 08:00 GMT Sell 0.70433 0.70397, 0.70360, 0.70324, 0.70287 0.70469 Loss 0.70433 0.70469 -4
October 29, 2026 at 12:30 AM GMT Oct 29, 26 00:30 GMT Buy 0.70497 0.70568, 0.70640, 0.70711, 0.70782 0.70426 TP2 Hit 0.70497 0.70640 +14
October 29, 2026 at 12:05 AM GMT Oct 29, 26 00:05 GMT Buy 0.70545 0.70554, 0.70564, 0.70573, 0.70583 0.70536 TP1 Hit 0.70545 0.70554 +1
October 28, 2026 at 3:00 PM GMT Oct 28, 26 15:00 GMT Buy 0.70344 0.70463, 0.70583, 0.70702, 0.70821 0.70225 TP2 Hit 0.70344 0.70583 +24
October 28, 2026 at 4:00 AM GMT Oct 28, 26 04:00 GMT Sell 0.70345 0.70331, 0.70317, 0.70303, 0.70289 0.70359 TP4 Hit 0.70345 0.70289 +6
October 27, 2026 at 8:00 PM GMT Oct 27, 26 20:00 GMT Buy 0.70289 0.70359, 0.70428, 0.70498, 0.70567 0.70219 TP4 Hit 0.70289 0.70567 +28
October 27, 2026 at 3:00 AM GMT Oct 27, 26 03:00 GMT Buy 0.70246 0.70406, 0.70566, 0.70726, 0.70886 0.70086 TP2 Hit 0.70246 0.70566 +32
October 26, 2026 at 9:00 PM GMT Oct 26, 26 21:00 GMT Sell 0.70164 0.69907, 0.69650, 0.69394, 0.69137 0.70421 Loss 0.70164 0.70421 -26
October 26, 2026 at 4:00 AM GMT Oct 26, 26 04:00 GMT Buy 0.70288 0.70355, 0.70422, 0.70489, 0.70556 0.70221 Loss 0.70288 0.70221 -7
October 26, 2026 at 12:00 AM GMT Oct 26, 26 00:00 GMT Sell 0.70294 0.70282, 0.70271, 0.70259, 0.70248 0.70306 TP2 Hit 0.70294 0.70271 +2
October 26, 2026 at 12:00 AM GMT Oct 26, 26 00:00 GMT Buy 0.70294 0.70331, 0.70368, 0.70405, 0.70442 0.70257 TP1 Hit 0.70294 0.70331 +4
October 23, 2026 at 11:00 AM GMT Oct 23, 26 11:00 GMT Buy 0.70167 0.70296, 0.70425, 0.70555, 0.70684 0.70038 TP3 Hit 0.70167 0.70555 +39
October 23, 2026 at 5:00 AM GMT Oct 23, 26 05:00 GMT Sell 0.70052 0.69711, 0.69371, 0.69030, 0.68689 0.70393 Loss 0.70052 0.70393 -34
October 22, 2026 at 2:00 PM GMT Oct 22, 26 14:00 GMT Buy 0.70136 0.70344, 0.70552, 0.70760, 0.70968 0.69928 TP2 Hit 0.70136 0.70552 +42
October 22, 2026 at 12:00 PM GMT Oct 22, 26 12:00 GMT Buy 0.70079 0.70227, 0.70376, 0.70524, 0.70673 0.69931 TP3 Hit 0.70079 0.70524 +44
October 22, 2026 at 9:00 AM GMT Oct 22, 26 09:00 GMT Sell 0.70138 0.69883, 0.69628, 0.69373, 0.69118 0.70393 Loss 0.70138 0.70393 -25
October 22, 2026 at 7:55 AM GMT Oct 22, 26 07:55 GMT Sell 0.70147 0.70120, 0.70092, 0.70065, 0.70037 0.70174 TP1 Hit 0.70147 0.70120 +3
October 21, 2026 at 11:00 PM GMT Oct 21, 26 23:00 GMT Buy 0.70224 0.70290, 0.70356, 0.70422, 0.70488 0.70158 TP2 Hit 0.70224 0.70356 +13
October 21, 2026 at 4:00 AM GMT Oct 21, 26 04:00 GMT Sell 0.70152 0.70136, 0.70120, 0.70104, 0.70088 0.70168 TP3 Hit 0.70152 0.70104 +5
October 20, 2026 at 7:55 PM GMT Oct 20, 26 19:55 GMT Buy 0.70012 0.70043, 0.70074, 0.70105, 0.70136 0.69981 TP4 Hit 0.70012 0.70136 +12
Binary Options

AUD/USD Binary Signals

The binary options record for AUD/USD: strike, direction and expiry on every call, settled Win, Loss or Tie.

Performance

Recent Results: Binary Options

Wins and losses by day across the last 30 trading sessions. Filter to a symbol to isolate its track.

Monthly Summary: Binary Options Click to toggle
Month, Year Total (Payout pts) AUD/USD
Month-to-date 2,605 2,605
September 2026 2,125 2,125
August 2026 425 425
July 2026 55 55
June 2026 -215 -215

Binary Options Signal Cards

AUD/USD 1 Minute
Put
Strike 0.70433
Expiry 1 Minute
Strategy SB Rules v1
Loss #130269
AUD/USD 30 Minutes
Call
Strike 0.70516
Expiry 30 Minutes
Strategy SB Rules v1
Tie #130246
AUD/USD 5 Minutes
Call
Strike 0.70538
Expiry 5 Minutes
Strategy SB Rules v1
Tie #130176
AUD/USD 1 Minute
Put
Strike 0.70345
Expiry 1 Minute
Strategy SB Rules v1
Win #130017
AUD/USD 1 Hour
Call
Strike 0.70302
Expiry 1 Hour
Strategy SB Rules v1
Win #129989
AUD/USD 1 Minute
Put
Strike 0.70289
Expiry 1 Minute
Strategy SB Rules v1
Win #129937
Trade Ledger

Last 20 Signals: Binary Options

Date, time Direction Strike Expiry State Result Payout
October 29, 2026 at 8:00 AM GMT Oct 29, 26 08:00 GMT Short 0.70433 1 Minute Settled Loss -100
October 29, 2026 at 4:00 AM GMT Oct 29, 26 04:00 GMT Long 0.70516 30 Minutes Settled Tie 0
October 28, 2026 at 8:55 PM GMT Oct 28, 26 20:55 GMT Long 0.70538 5 Minutes Settled Tie 0
October 28, 2026 at 4:00 AM GMT Oct 28, 26 04:00 GMT Short 0.70345 1 Minute Settled Win +85
October 28, 2026 at 12:00 AM GMT Oct 28, 26 00:00 GMT Long 0.70302 1 Hour Settled Win +85
October 27, 2026 at 8:00 PM GMT Oct 27, 26 20:00 GMT Short 0.70289 1 Minute Settled Win +85
October 26, 2026 at 7:55 AM GMT Oct 26, 26 07:55 GMT Short 0.70268 5 Minutes Settled Win +85
October 26, 2026 at 4:00 AM GMT Oct 26, 26 04:00 GMT Short 0.70288 1 Minute Settled Win +85
October 26, 2026 at 12:00 AM GMT Oct 26, 26 00:00 GMT Short 0.70294 1 Minute Settled Win +85
October 25, 2026 at 10:00 PM GMT Oct 25, 26 22:00 GMT Long 0.70364 5 Minutes Settled Win +85
October 23, 2026 at 12:00 AM GMT Oct 23, 26 00:00 GMT Long 0.70196 1 Hour Settled Tie 0
October 21, 2026 at 4:00 PM GMT Oct 21, 26 16:00 GMT Short 0.70253 1 Minute Settled Win +85
October 21, 2026 at 12:00 PM GMT Oct 21, 26 12:00 GMT Long 0.70313 5 Minutes Settled Win +85
October 21, 2026 at 4:00 AM GMT Oct 21, 26 04:00 GMT Short 0.70152 1 Minute Settled Win +85
October 20, 2026 at 8:00 PM GMT Oct 20, 26 20:00 GMT Long 0.7001 5 Minutes Settled Win +85
October 20, 2026 at 12:00 PM GMT Oct 20, 26 12:00 GMT Long 0.69842 1 Hour Settled Win +85
October 20, 2026 at 12:00 AM GMT Oct 20, 26 00:00 GMT Long 0.69822 1 Minute Settled Win +85
October 19, 2026 at 11:55 PM GMT Oct 19, 26 23:55 GMT Long 0.69812 5 Minutes Settled Win +85
October 19, 2026 at 8:00 AM GMT Oct 19, 26 08:00 GMT Long 0.69696 30 Minutes Settled Win +85
October 18, 2026 at 10:00 PM GMT Oct 18, 26 22:00 GMT Long 0.69635 1 Minute Settled Win +85
Futures

Australian Dollar (6A JUN26) Futures Signals

The futures record for Australian Dollar (6A JUN26): the same instrument traded on the exchange contract, with its own entry, stop and targets.

Performance

Recent Results: Futures

Per-symbol net percentage outcome by day across the last 30 trading sessions. Filter to a symbol to isolate its track.

Monthly Summary: Futures Click to toggle
Month, Year Total (Net %) 6A JUN26
Month-to-date 12.0 12.0
September 2026 188.0 188.0
August 2026 642.0 642.0
July 2026 57.0 57.0
June 2026 188.0 188.0

Futures Signal Cards

6A JUN26 1 Hour
Buy
Entry 0.7022
Stop Loss 0.7015
TP1 0.7029
TP2 0.7036
TP3 0.7043
TP4 0.7050
TP4 Hit #129942
6A JUN26 4 Hours
Sell
Entry 0.7011
Stop Loss 0.7036
TP1 0.6986
TP2 0.6961
TP3 0.6937
TP4 0.6912
Loss #129774
6A JUN26 4 Hours
Sell
Entry 0.7006
Stop Loss 0.7033
TP1 0.6979
TP2 0.6952
TP3 0.6925
TP4 0.6898
Loss #129247
6A JUN26 1 Hour
Buy
Entry 0.6975
Stop Loss 0.6962
TP1 0.6988
TP2 0.7002
TP3 0.7015
TP4 0.7028
TP4 Hit #128471
6A JUN26 4 Hours
Sell
Entry 0.6939
Stop Loss 0.6964
TP1 0.6914
TP2 0.6889
TP3 0.6864
TP4 0.6839
Loss #128296
6A JUN26 4 Hours
Sell
Entry 0.6935
Stop Loss 0.6976
TP1 0.6894
TP2 0.6852
TP3 0.6811
TP4 0.6769
Loss #127976
Trade Ledger

Last 20 Signals: Futures

Date, time Order Price Take Profit Stop Loss State Entry Exit Profit
October 27, 2026 at 8:00 PM GMT Oct 27, 26 20:00 GMT Buy 0.7022 0.7029, 0.7036, 0.7043, 0.7050 0.7015 TP4 Hit 0.7022 0.7050 +28
October 26, 2026 at 10:00 PM GMT Oct 26, 26 22:00 GMT Sell 0.7011 0.6986, 0.6961, 0.6937, 0.6912 0.7036 Loss 0.7011 0.7036 -25
October 23, 2026 at 6:00 AM GMT Oct 23, 26 06:00 GMT Sell 0.7006 0.6979, 0.6952, 0.6925, 0.6898 0.7033 Loss 0.7006 0.7033 -27
October 19, 2026 at 4:00 PM GMT Oct 19, 26 16:00 GMT Buy 0.6975 0.6988, 0.7002, 0.7015, 0.7028 0.6962 TP4 Hit 0.6975 0.7028 +53
October 16, 2026 at 10:00 PM GMT Oct 16, 26 22:00 GMT Sell 0.6939 0.6914, 0.6889, 0.6864, 0.6839 0.6964 Loss 0.6939 0.6964 -25
October 16, 2026 at 6:00 AM GMT Oct 16, 26 06:00 GMT Sell 0.6935 0.6894, 0.6852, 0.6811, 0.6769 0.6976 Loss 0.6935 0.6976 -41
October 7, 2026 at 3:00 PM GMT Oct 7, 26 15:00 GMT Sell 0.6953 0.6938, 0.6924, 0.6909, 0.6894 0.6968 TP1 Hit 0.6953 0.6938 +15
October 2, 2026 at 10:00 PM GMT Oct 2, 26 22:00 GMT Sell 0.6949 0.6926, 0.6902, 0.6879, 0.6856 0.6972 TP1 Hit 0.6949 0.6926 +23
September 25, 2026 at 9:00 PM GMT Sep 25, 26 21:00 GMT Sell 0.7016 0.6997, 0.6978, 0.6958, 0.6939 0.7035 TP4 Hit 0.7016 0.6939 +77
September 25, 2026 at 8:00 PM GMT Sep 25, 26 20:00 GMT Sell 0.7020 0.7005, 0.6990, 0.6974, 0.6959 0.7035 TP4 Hit 0.7020 0.6959 +61
September 21, 2026 at 10:00 PM GMT Sep 21, 26 22:00 GMT Sell 0.7109 0.7085, 0.7061, 0.7037, 0.7013 0.7133 TP4 Hit 0.7109 0.7013 +96
September 21, 2026 at 2:00 AM GMT Sep 21, 26 02:00 GMT Buy 0.7115 0.7137, 0.7160, 0.7182, 0.7204 0.7093 Loss 0.7115 0.7093 -22
September 18, 2026 at 10:00 PM GMT Sep 18, 26 22:00 GMT Buy 0.7115 0.7137, 0.7160, 0.7182, 0.7204 0.7093 Loss 0.7115 0.7093 -22
September 18, 2026 at 8:00 AM GMT Sep 18, 26 08:00 GMT Sell 0.7116 0.7104, 0.7092, 0.7080, 0.7068 0.7128 TP1 Hit 0.7116 0.7104 +12
September 18, 2026 at 6:00 AM GMT Sep 18, 26 06:00 GMT Sell 0.7114 0.7095, 0.7075, 0.7056, 0.7036 0.7133 TP4 Hit 0.7114 0.7036 +78
September 16, 2026 at 1:00 PM GMT Sep 16, 26 13:00 GMT Sell 0.7121 0.7114, 0.7107, 0.7100, 0.7093 0.7128 TP4 Hit 0.7121 0.7093 +28
September 15, 2026 at 8:00 PM GMT Sep 15, 26 20:00 GMT Sell 0.7121 0.7114, 0.7107, 0.7100, 0.7093 0.7128 TP4 Hit 0.7121 0.7093 +28
September 11, 2026 at 11:00 AM GMT Sep 11, 26 11:00 GMT Sell 0.7158 0.7150, 0.7143, 0.7135, 0.7127 0.7166 TP2 Hit 0.7158 0.7143 +15
September 10, 2026 at 6:00 AM GMT Sep 10, 26 06:00 GMT Buy 0.7220 0.7235, 0.7249, 0.7264, 0.7279 0.7205 Loss 0.7220 0.7205 -15
September 9, 2026 at 12:00 PM GMT Sep 9, 26 12:00 GMT Buy 0.7221 0.7233, 0.7244, 0.7256, 0.7267 0.7209 TP1 Hit 0.7221 0.7233 +12
FAQs

Common questions about AUD/USD signals

How fast do signals reach me?

Every signal pushes to you in under 10 milliseconds from when our engine fires. It lands on the web dashboard, Telegram, our browser extension, and the mobile app at the same time, so you never miss an entry.

What forex markets do you cover?

Every forex instrument with a live track record shows up as a card on this page, busiest first. Tap any card to open its full signal history.

What's inside each signal?

A clear direction (Buy or Sell), an entry price, a protective stop loss, and take-profit targets, plus a live status that updates as the trade plays out.

How should I size each trade?

We suggest risking 1–2% of your account per trade. Your position size then follows from the stop distance on each signal and the risk percentage you're comfortable with.

Where can I see past results?

Right on this page: the Recent Results chart and the full statistics panel above show every tracked outcome. We publish the complete record, wins and losses alike.

How will I receive signals?

Through whichever channels suit you: the web dashboard, Telegram, our browser extension, and the mobile app all stay in sync, so each signal reaches you wherever you are.

How do I get VIP access?

VIP access comes with every plan; message our team and we'll set you up.

Do you guarantee profits?

No, and be wary of anyone who does. Forex trading carries substantial risk. Read our Risk Warning and judge the historical edge for yourself before subscribing.

Can I cancel any time?

Yes. Cancel in one click from your dashboard, no hidden fees and no auto-renewal traps.

Still have questions?

Our team is happy to help before you join; get in touch and we'll walk you through anything you're unsure about.

Commodity-driven trend

AUD/USD Forex Signals Tied to Commodities and China

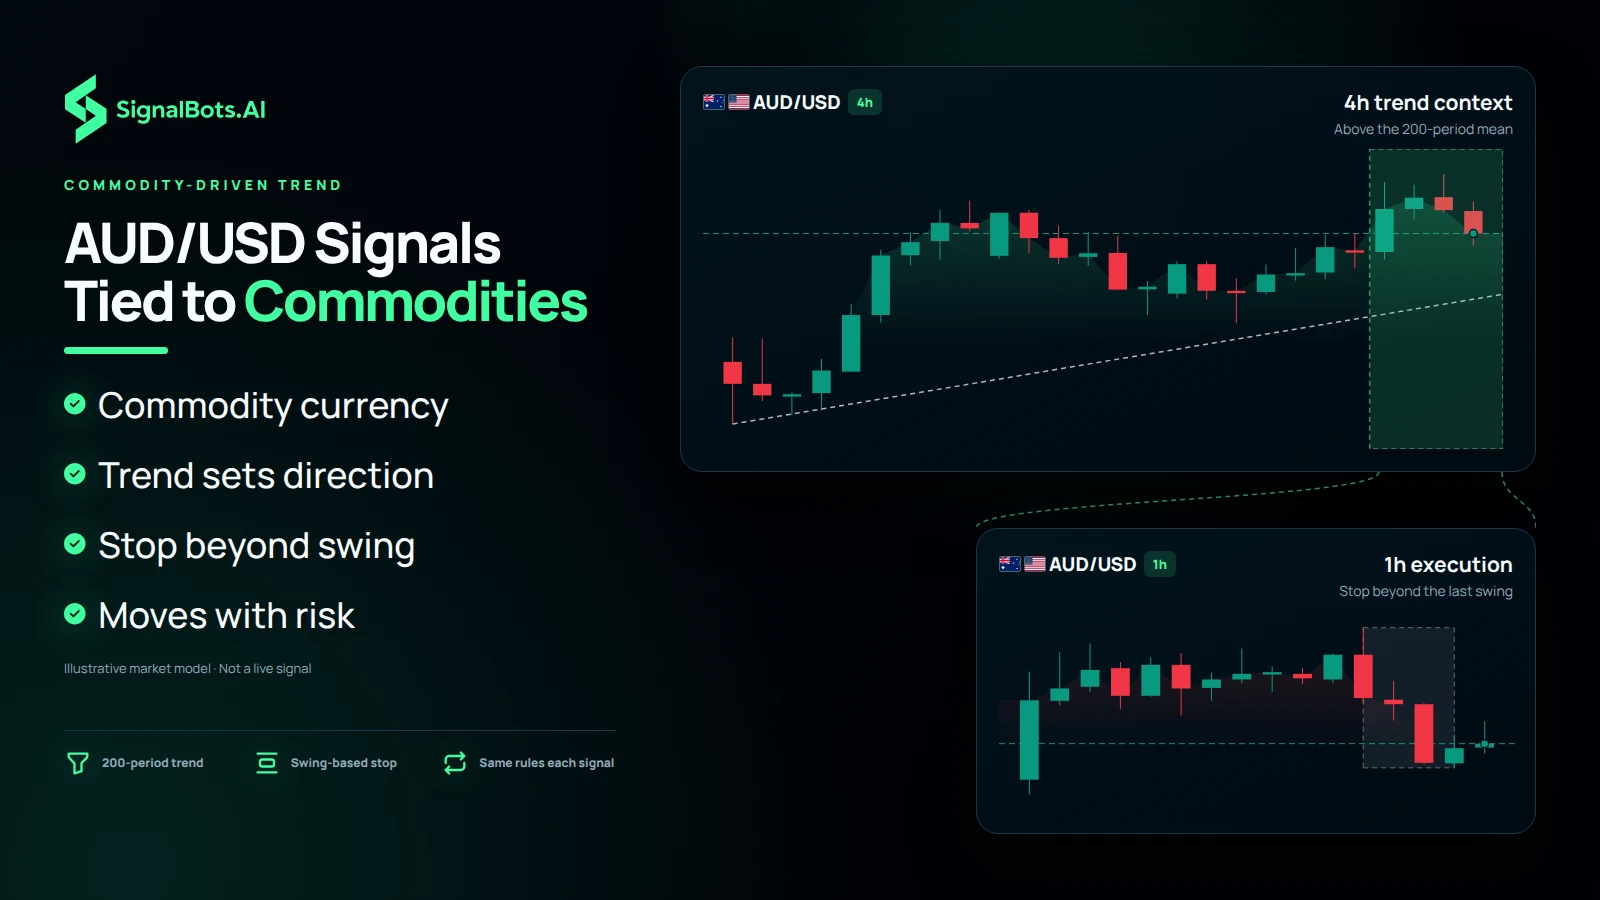
The Australian dollar is a commodity currency: iron ore, coal and gas exports, Chinese demand and the Reserve Bank of Australia's rate path all show up in AUD/USD. It also moves with global risk appetite, rising when markets are confident and falling when they are not. Each AUD/USD signal follows the trend that results, read from price against its 200-period average, and places its stop beyond the pair's most recent ten-candle swing.

Dark section image headlined “AUD/USD Signals Tied to Commodities”: a 4h AUD/USD chart labelled “4h trend context, above the 200-period mean” whose bracket opens into a 1h execution chart with a pullback entry, beside points on commodity currency, trend direction and a stop beyond the swing.
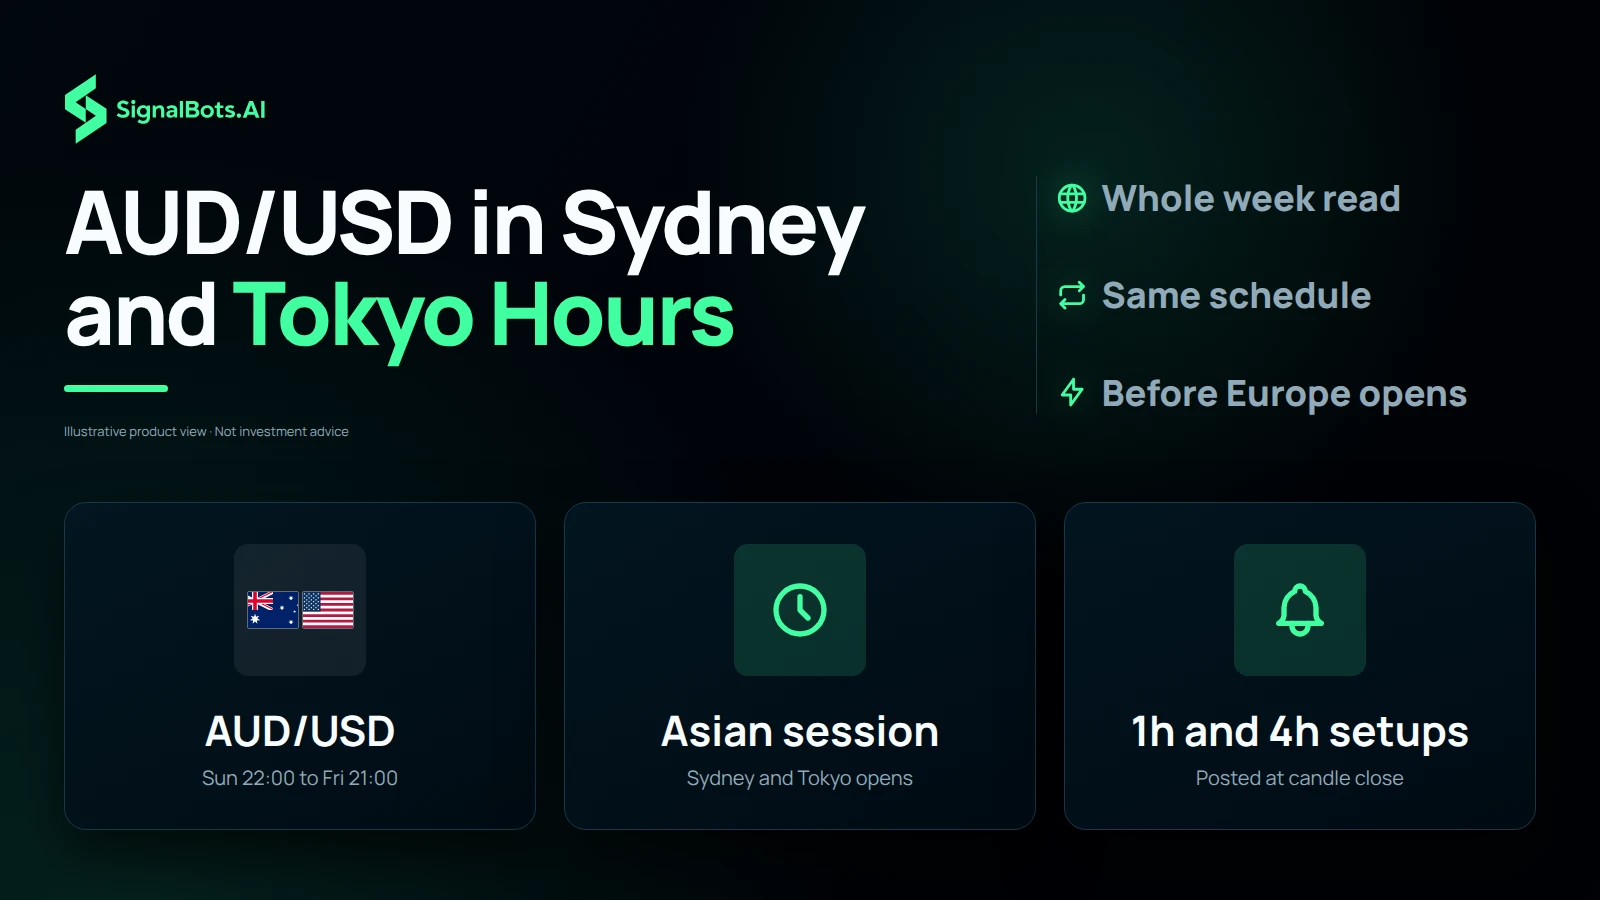
Dark image headlined “AUD/USD in Sydney and Tokyo Hours” with three tiles: the AUD/USD flags with Sun 22:00 to Fri 21:00, a clock for the Asian session at the Sydney and Tokyo opens, and a bell for 1h and 4h setups posted at candle close.

Asian session coverage

AUD/USD Trading Signals in the Sydney and Tokyo Hours

AUD/USD comes alive earlier than most majors, when Sydney and Tokyo open and Australian and Chinese data are released. The pair is read on schedule through the entire trading week, so a 1h or 4h setup that forms during the Asian session is published as soon as its candle closes, hours before Europe arrives. For traders in Asia and Australia, that means setups on a pair that actually moves during their daytime.

Correlated exposure

AUD/USD Signals Next to Gold and Iron Ore

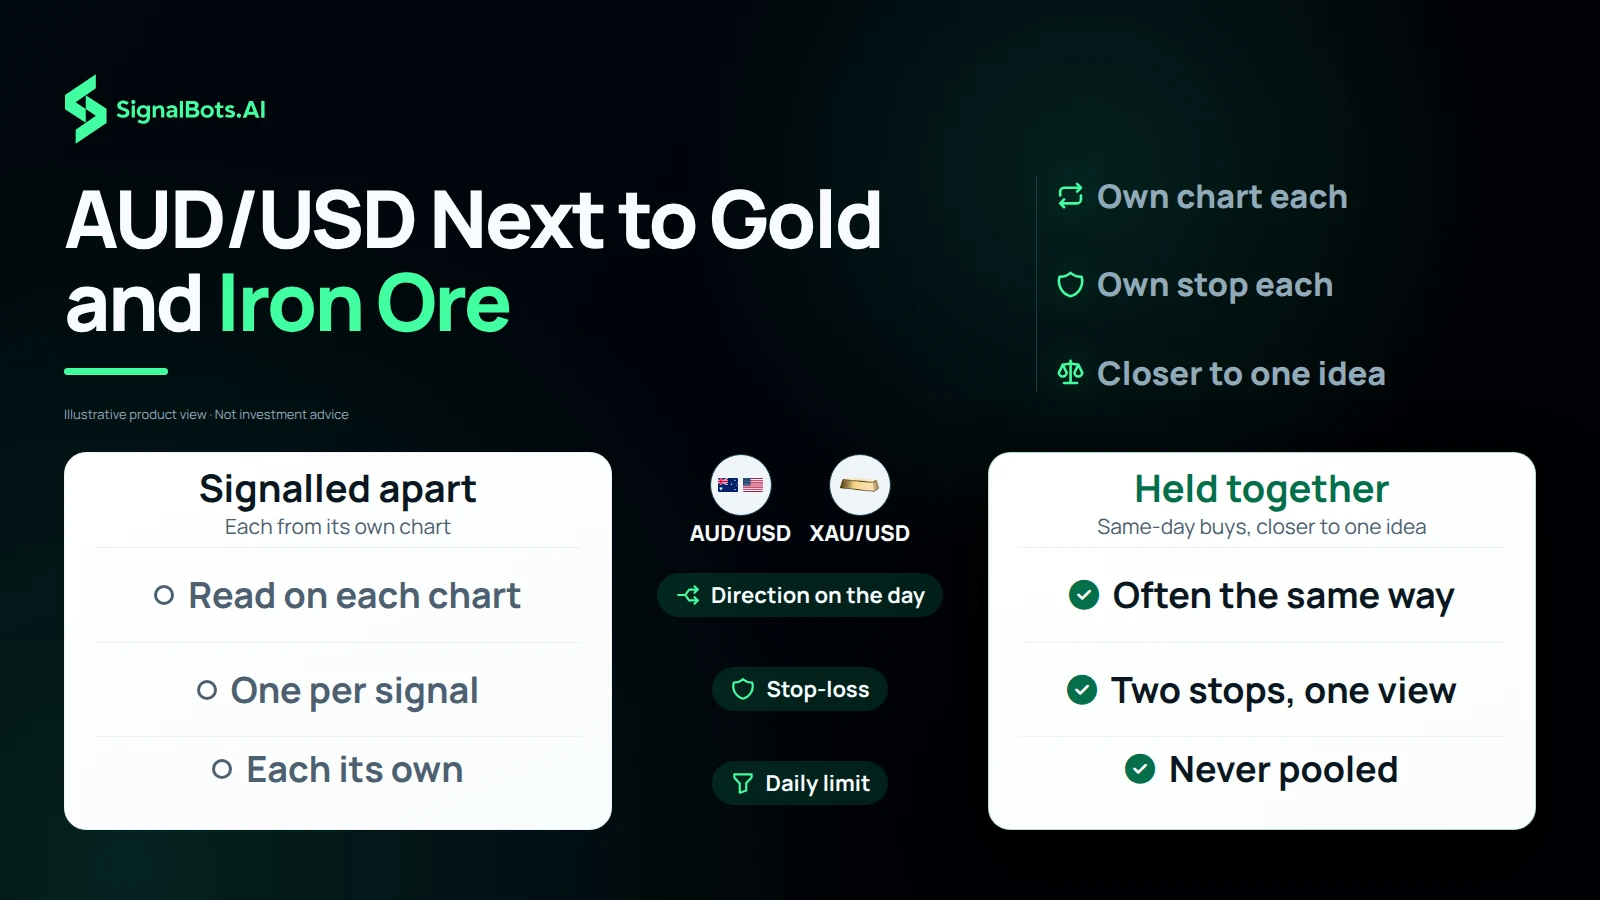
Because Australia is a major exporter of gold, iron ore and coal, AUD/USD often moves in the same direction as commodity prices, and it has tended to track gold in particular. If you also follow the metals signals on this site, an AUD/USD buy and a gold buy on the same day may be closer to one idea than two. Each is still signalled from its own chart, with its own stop and its own daily limit.

Duotone comparison headlined “AUD/USD Next to Gold and Iron Ore”, with AUD/USD and XAU/USD marks above two panels: “Signalled apart”, each read from its own chart with one stop per signal, and “Held together”, often moving the same way with two stops and daily limits never pooled.
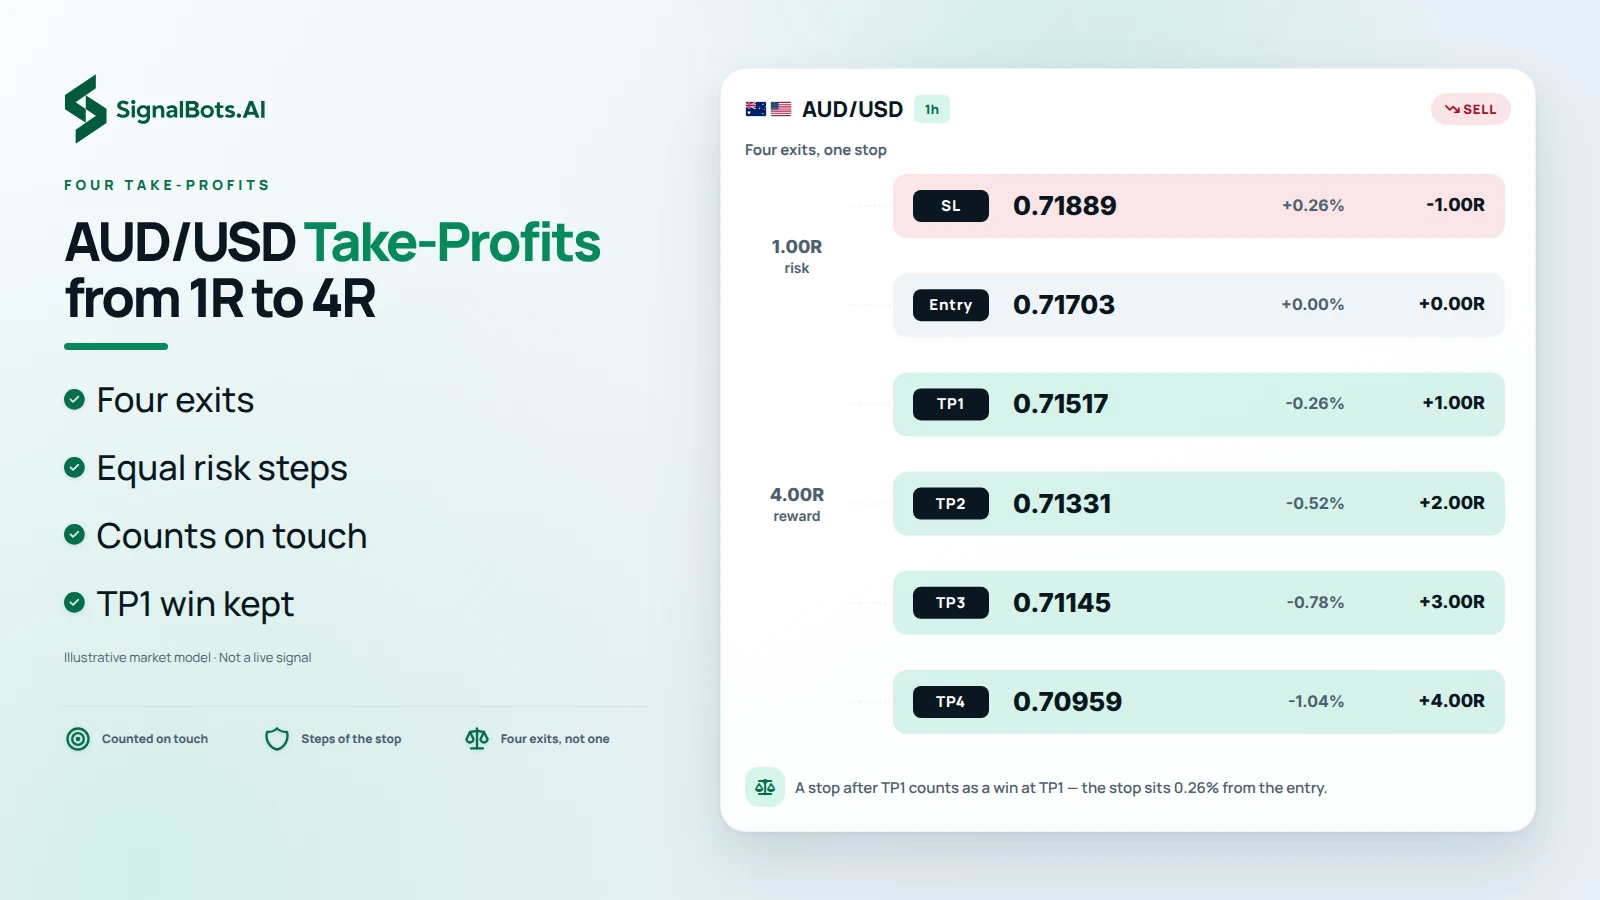
Light risk ladder headlined “AUD/USD Take-Profits from 1R to 4R”: an illustrative 1h AUD/USD sell plan drawn to scale with the stop-loss, entry and four take-profits from TP1 at 1.00R to TP4 at 4.00R, noting that a stop after TP1 counts as a win at TP1.

Four take-profits

AUD/USD Take-Profit Targets from 1R to 4R

A commodity-driven pair can extend further than expected or reverse on a single Chinese data print, so each AUD/USD signal offers four exits instead of one. The take-profits are spaced in equal steps of the stop distance, TP1 at 1R through TP4 at 4R, and each is recorded the moment price touches it. A stop hit after TP1 leaves the trade counted as a win at TP1, the level where the plan first told you to take profit.

Separate market records

AUD/USD Binary and Australian Dollar Futures (6A) Signals

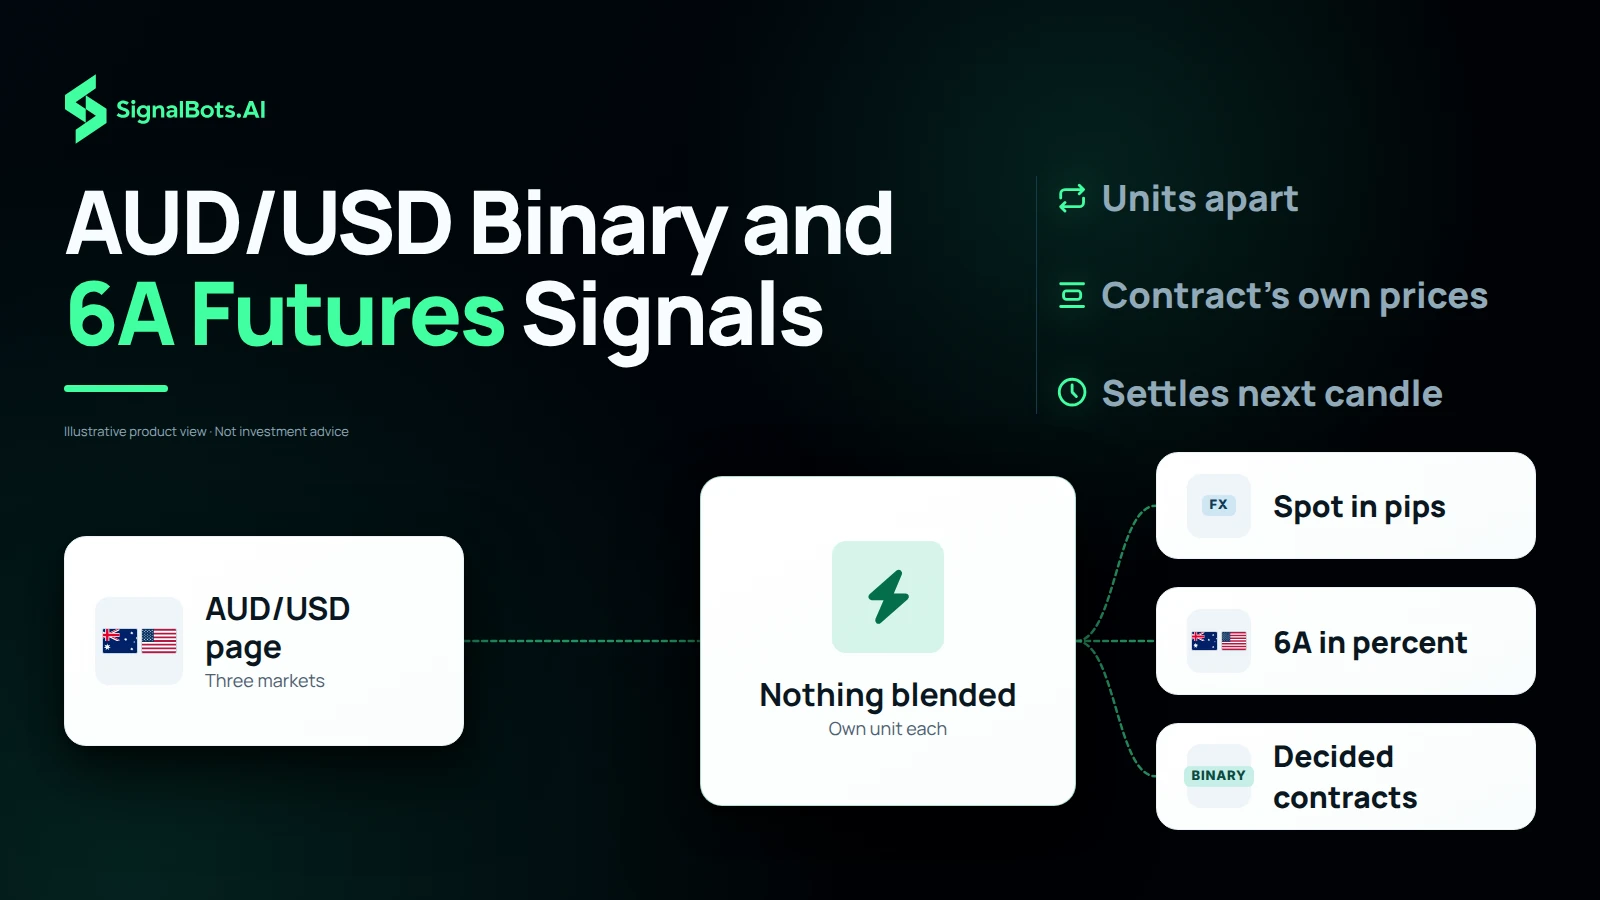
This page also carries the Aussie's two other markets: AUD/USD binary options and the CME Australian dollar futures contract, 6A. Binary signals share the spot pair's direction rule but settle one candle after the close they were read from. 6A signals are built from the futures contract's own prices, which include the interest-rate difference between the two currencies. The three records sit in separate sections, each in its own unit, so none of them inflates another.

Duotone flow diagram headlined “AUD/USD Binary and 6A Futures Signals”: the AUD/USD page, marked with its flags, feeds a “Nothing blended, own unit each” hub that routes to spot forex in pips, 6A futures in percent and binary options as decided contracts.

Win Rate

Wins vs losses
80%
Win Rate

Gain Chart

Cumulative growth over the last 120 days
Past performance is not indicative of future results. Forex trading carries substantial risk. Review our Risk Warning before subscribing.
ROI Calculator

What if you traded with us?

Move the slider: see the cumulative return our tracked signals produced over the last 7 days, applied to your starting capital.

Starting $1,000
After last 7 days $1,760 +$760
Hypothetical, based on historical Win Rate. Not a guarantee of future returns.
+69.9%
Total Gain
19.74%
Max Drawdown
+$5610.0
Net Profit
Full Advanced Statistics Click to expand

Advanced Statistics

Updated Oct 29, 2026 · 11:10 GMT
Balance $15610.0
Equity (100.00%) $15610.0
Floating PL $0.0
Deposits $10000.0
Withdrawals $0
Trades 177
Pips 561
Won 97%
Avg. Trade Time
Lots 23.01
Profit Factor 5.07
Daily 0.32%
Monthly 9.51%
Trades Per Month 30
Expectancy 19.2 Pips / $192.0
Built for your broker

Keep your broker. Keep your edge.

No switching accounts, no relearning a platform. Whichever forex broker you already trade with, these signals plug straight in. Read them here, or let our extensions, robots and connectors act on them for you.

Trusted by traders

What AUD/USD Traders Are Saying

A AUD/USD trade plan I can check before acting

On the Forex signals page, the AUD/USD entry, stop and targets give me a defined checklist instead of a rushed decision.

William Johansson
William Johansson Sweden

AUD/USD history makes the process easier to review

I use the Forex Recent Results and AUD/USD monthly table to study the setup before I decide whether it fits my own risk plan.

Nurul Ismail
Nurul Ismail Malaysia

AUD/USD levels help me avoid chasing

Seeing the Forex AUD/USD stop alongside the target keeps me patient when price is already moving quickly.

Haruto Takahashi
Haruto Takahashi Japan

AUD/USD context without hiding the risk

The Forex AUD/USD page makes the outcome history visible, so I can keep position size and risk limits under my own control.

Mei Wang
Mei Wang China

One focused view for AUD/USD

The Forex AUD/USD alerts and symbol filters make it much easier to follow the instruments I actually trade.

Jennifer Williams
Jennifer Williams United States

Ready to trade AUD/USD with us?

Full access to every signal, with instant alerts on the web, Telegram, our extension and mobile app.

No card needed
VIP Access $49/mo · 7-day free trial