Someone sends you a link. A Chrome extension, a Telegram bot, or a downloadable "robot" that watches Olymp Trade and tells you whether the next candle closes up or down. The page carries one number in large type — 70%, 85%, sometimes 91% — and somewhere below it, in much smaller type, a line admitting that profit is not guaranteed.
Those two statements are not doing the same job. The first exists to make you deposit. The second exists to make the first one survivable.
This page is about the number itself. Not whether one particular robot is legitimate, and not how to install one — but what a direction forecast is mechanically capable of telling you, what any accuracy percentage has to disclose before it carries information, and the arithmetic that decides whether a given win rate is worth trading at all. By the end you should be able to take apart any prediction bot's headline claim in about two minutes, with questions the vendor either answers or doesn't.
Key Takeaways
Accuracy is never a property of the software alone — it belongs to a bot, an instrument, an expiry, a session, a period and a payout, together.
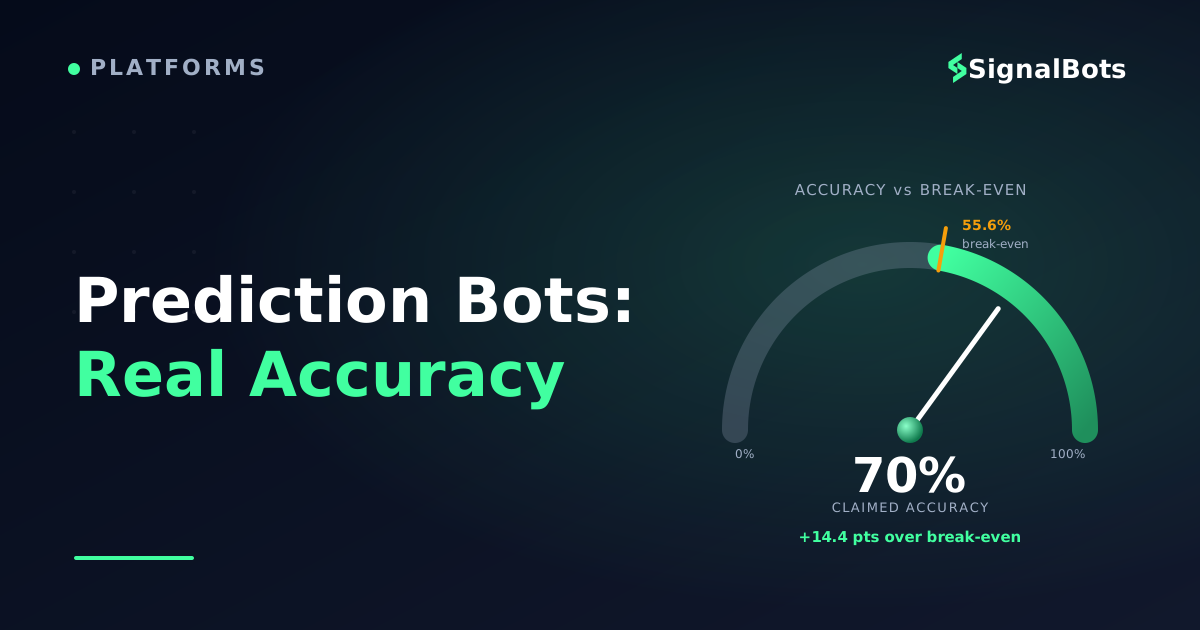
Because a winning fixed-time trade pays back less than a losing one costs, the break-even win rate always sits above 50% — near 55.6% at an 80% payout.
A claim you cannot check is not a measurement: ask for the sample size, the test type, the payout assumed and the full log with losers included.
Treat a forecast that survives those checks as one input to confirm on a demo account, sized for the losing streak rather than the average.
Table of Contents (25 min read)Contents
What a Prediction Bot Actually Does (and Doesn't) Forecast
A prediction bot is not looking into the future. It is a pattern-matching engine pointed backwards, and its output is a statement about history dressed as a statement about the next sixty seconds.
Strip the branding off almost any binary options bot and the same four moves are inside it: sample the current state of price and a handful of indicators, find past moments that looked similar, count how those moments resolved, and print the more frequent outcome as a direction.
The mechanism
What happens between the chart and the CALL/PUT label
1
Read the current state
It samples recent price along with indicator values — momentum, volatility, moving averages — into a numeric snapshot of right now.
2
Match it against history
It searches its dataset for past moments whose snapshot looked similar, and counts how those moments actually resolved.
3
Turn the count into a direction
The tally becomes a probability, then a label: CALL or PUT, often with a confidence figure attached to make it feel precise.
4
Hand you a call, not a certainty
You get a direction and an expiry. The market never sees this output and is under no obligation to respect it.
Every prediction bot is a backward-looking frequency count with a forward-looking label on the front.
That distinction matters more than it sounds. When a bot says "CALL, 87% confidence," it is not saying the price will rise 87 times out of 100 from here. It is saying: among the past situations my dataset judged similar to this one, this share went up before the clock ran out. Whether "similar" was defined well, and whether today's market resembles the market that produced those examples, are open questions the signal confidence score itself cannot answer.
Three things sit permanently outside what such a model can see:
The reason price is moving right now. A scheduled release, a large order working through the book, a thin holiday session — the bot reads the shape, not the cause.
The specific contract you are about to buy. Direction and duration are separate problems. A model tuned to "up over the next hour" tells you very little about a 60-second expiry time, and vendors routinely blur the two.
How the price you are trading is produced. On weekends and outside exchange hours, fixed-time platforms quote synthetic OTC market instruments. A pattern learned on exchange-hours data is being applied to a different price-generating process, and nothing in the interface tells you that.
None of this makes a prediction bot useless. It makes it a filter with a measurable hit rate under stated conditions — which is a real thing, and a much smaller thing than the marketing suggests.
How Accurate Are Olymp Trade Prediction Bots, Really?
The honest answer has two halves, and the first one is uncomfortable: for any specific bot being advertised to you, nobody outside the vendor knows — including, quite often, the vendor. A percentage published without the conditions that produced it is not an accuracy measurement. It is a design element.
The second half is more useful. Accuracy is not a property a bot has, like a serial number. It is a property of a combination: this bot, on this instrument, at this expiry, in this session, over this period, priced at this payout. Change any one of those and the number changes with it. The same rule set that reads short-expiry momentum well during the London session can bleed steadily through a quiet Asian range, and a vendor is free to quote you whichever slice looked best. The headline figure is one reading taken out of a crowd of them — the conditions behind it are what you are actually being asked to trust.
So the realistic expectation to hold is this: a genuine directional edge on short expiries is small, fragile and conditional. Small, because the patterns are visible to everyone with a chart. Fragile, because market conditions rotate and a rule tuned to one regime decays in the next. Conditional, because it only exists inside the exact conditions it was measured in. Any figure presented as a fixed, universal property of the software — "91% accurate," full stop — is describing something that cannot exist in that form.
That is not a reason to dismiss every tool. It is a reason to stop treating the headline number as the thing you evaluate, and start evaluating the measurement behind it.
Why a Headline Accuracy Number Alone Tells You Almost Nothing
A bare percentage hides at least six things, and each one can flip the conclusion on its own.
Sample size. Forty trades can produce a 70% run from a coin flip without anything unusual happening. Without a stated sample size, a win rate is an anecdote with a decimal point.
Backtest or live. A backtest result and a forward test result are different claims about different things. Only the second one was produced under real fills, real spreads and real hesitation.
Whether the rules were tuned on the same data. Optimise a parameter set until it fits a stretch of history and the reported accuracy on that stretch stops being evidence. That is overfitting, and it is the single most common way an honest developer fools himself.
Indicator behaviour on completed bars. Some indicators redraw their own history as new data arrives. If the bot was tested on a chart where that happened, the entries were chosen with information that did not exist at the time — repainting and look-ahead bias produce beautiful curves and unrepeatable results.
Which runs you are shown. Ten configurations tested, one screenshot published, nine deleted. The surviving number is not a measurement of the strategy; it is a measurement of the selection.
What counted as a win. If a loss recovered by a doubled follow-up stake gets logged as a win, the win rate is describing a bookkeeping convention, not the model.
Two bots, the same "70%," opposite realities
Put two hypothetical vendor pages side by side. Both print exactly the same headline. Everything that decides whether the number is worth anything sits in the rows underneath it.
Same number, different evidence
What sits behind the claim
Bot A
Bot B
Headline on the page
70% accurate
70% accurate
Sample the number came from
1,140 trades across nine months
40 trades in one afternoon
How it was tested
Forward-tested on a demo feed, logged live
Backtested on the same data the rules were tuned on
Conditions stated
One pair, 5-minute expiry, London session
"All assets, any expiry, 24/7"
Losing trades visible
Full log, worst streak included
Winners only, in a highlights reel
Payout the result assumes
Stated per trade, so you can redo the maths
Not mentioned anywhere
What the 70% is worth to you
A measurable, testable edge under named conditions
No information at all
Illustrative example: identical headline figures, and only one of them is a measurement.
Bot B is not necessarily lying. It may simply never have measured anything. The practical consequence is the same either way — you cannot act on it, because there is no way to tell whether the next hundred trades will resemble the forty that produced the claim.
The Break-Even Math a Bot Has to Clear Before It's Worth Using
Here is the part the marketing pages skip, and it is the reason "70% accurate" and "70% profitable" are not the same sentence.
Fixed-time contracts pay asymmetrically. Win, and you receive your stake back plus the payout percentage. Lose, and the entire stake is gone. That asymmetry is the platform's business model, and it means a coin-flip win rate is a slow, one-directional drain — not a neutral outcome.
The payoff asymmetry
Why 50% is not the neutral point
━ Call payoff━ Put payoffx-axis: underlying price at expiry • y-axis: P&L per $100 staked
A winner returns less than a loser costs — so the break-even win rate always sits above half.
The arithmetic is short. If a winning trade pays 80% of your stake and a losing trade costs 100% of it, then out of every ten trades you need enough winners to cover the losers at a worse-than-even exchange rate. Formally, the break-even win rate is one divided by one-plus-the-payout: at an 80% payout that lands near 55.6%, and at a 90% payout near 52.6%. This is the same idea as a reward-to-risk ratio in any other market, just expressed in the platform's own units — you are being paid less than 1:1 on every trade you win.
Two consequences follow immediately.
A "70% accurate" claim is not a 70% edge — it is at best a 14-point margin over break-even, and only if the 70% was real and the payout was 80%. Shift the payout down or the win rate down by a few points each and the margin disappears entirely. That fragility is why the payout the vendor assumed matters as much as the accuracy they quote.
A win rate below the break-even line loses money no matter how good it feels. A bot that wins 54% of the time at an 80% payout is a losing system with a pleasant hit rate, and it will feel like it is working right up until the account is empty. This is the whole content of expectancy: the sign of the average trade, not the frequency of the pleasant ones.
Run your own numbers rather than trusting the shape of the argument:
Run it yourself
Does this claimed win rate actually clear break-even?
Enter the payout your own account shows and the win rate the bot claims. The result is illustrative arithmetic on a fixed stake — not a projection of what you will earn.
Payout on a winning trade
Claimed or measured win rate
Stake per trade
$
Trades in the sample
Break-even win rate
—
Margin over break-even
—
Result over the sample
—
Drop the win rate a few points, or the payout a few points, and watch how quickly the margin over break-even evaporates.
One more thing the math alone will not show you: even a genuinely positive edge arrives in a jagged order. A system comfortably above break-even still produces long runs of consecutive losses, and the stake size that survives those runs is a separate decision from the entry logic. If you plan to trade a forecast at all, size it against the losing streak, not against the average — the risk-of-ruin calculator shows how quickly stake size, not accuracy, becomes the binding constraint.
Is a 70% (or 90%) Accuracy Claim Believable? A Verification Checklist
Believability is not about the size of the number. A modest, precisely-conditioned claim is far more credible than an impressive vague one. What separates them is whether the claim can be checked at all.
Work through these before you attach money to any forecast. Every item is something the seller can answer in one message, and the refusal to answer is itself the answer.
Before you attach money
Seven questions that turn an accuracy claim into a measurement
0 / 7
Ask for the sample: how many trades, over what date range, on which instruments and which expiry.
Ask whether the figure is backtested or forward-tested on live prices — and ask for it in writing.
Ask to see the full trade log in order, losers included, not a reel of winning screenshots.
Check which payout the result assumes, then compare it against the payout your own account displays.
Ask whether the rules were tuned on the same data the result is quoted from, and what was tested out of sample.
Compare the number across the sales page, the pinned Telegram post and the terms — a figure that drifts between surfaces was never measured.
Reproduce it yourself on a demo account, on your instrument, and compare your own log against the claim.
★
Checklist complete — you’re cleared to proceed.
A claim that survives all seven is still not a promise — it is simply a claim you can now test.
The phrasing itself carries most of the signal. Compare how the two kinds of claim actually read:
How the claim is worded
Reads like a measurement
Reads like a marketing number
"68% of 1,140 signals on EUR/USD, 5-minute expiry, forward-tested January to September."
"Up to 91% accuracy."
"Worst losing streak in the sample: 11 trades in a row."
"Consistent daily profits."
"Backtested only. Not yet forward-tested on live prices."
"Proven algorithm — works in any market condition."
"Results assume an 80% payout; yours may differ, so redo the arithmetic."
"Risk-free signals" — a phrase no honest tool uses.
"Accuracy fell noticeably during weekend OTC hours."
"Works 24/7 on every asset."
Illustrative phrasings. The credible column is less exciting on purpose — it is constrained by having been measured.
Notice what the left column keeps doing: naming limits. A verified track record is not one that looks impressive, it is one that specifies the conditions tightly enough that you could disprove it. Anything that cannot be disproved cannot be confirmed either.
Two neighbouring questions sit deliberately outside this section. Whether Olymp Trade robots are legitimate at all is a screening question about the vendor rather than the forecast, and how to set an Olymp Trade robot up is a separate mechanical walkthrough — both are covered on their own pages, and neither changes the arithmetic above.
How to Use a Prediction Bot's Forecast Without Overtrusting It
Suppose a bot clears the checklist. It has a stated sample, a stated payout, a visible losing streak, and a margin over break-even that survives your own arithmetic. What do you actually do with its output?
Demote it. A forecast that has been honestly measured is a lead, not a trigger — an input that earns a look, not a reason to click. One gauge agreeing with itself is not confirmation — the call earns a trade only when your own read points the same way.
In practice that means four habits:
Require your own confirmation. Take the direction only when it agrees with something you would have traded anyway — a level, a structure break, a session bias you can see on the chart. A false signal you filtered out costs nothing; one you took because the software said so costs a full stake.
Match the expiry to the test. If the claimed accuracy came from 5-minute expiries, a 1-minute contract is a different instrument and the number does not travel with you.
Keep the stake fixed. Doubling after a loss converts a small negative edge into a fast one. A martingale strategy bolted onto a forecast does not repair the forecast; it hides the losses until it can't.
Collect your own sample before you scale. Run the calls on a demo account and log every one, including the ones you skipped and why. Your log on your instrument is worth more than the vendor's entire landing page, because it was produced under your conditions.
That habit — insisting on seeing the reasoning rather than the score — is also how we build our own free binary options signal feed: each call carries its direction, instrument and expiry openly, so you can judge the read behind it instead of accepting a bare percentage. It is a second input to confirm and demo-test like any other, not a prediction engine and not a promise of the accuracy figures this article just taught you to interrogate. If you would rather assemble your own inputs from free Olymp Trade signals or a Telegram signal channel, the same seven questions apply unchanged.
Whatever you route into your account, the stake is genuinely at risk on every fixed-time contract — the risk warning sets out plainly what that means, and every figure on this page is arithmetic or a historical measurement, never an expectation of future results.
The Honest Bottom Line on Prediction-Bot Accuracy
A prediction bot can hold a small, conditional, decaying edge, and it can be a well-built tool worth having in your process. What it cannot be is a fixed accuracy percentage that travels across instruments, expiries, sessions and payouts unchanged. The moment a claim stops naming its conditions, it has stopped describing the software and started describing the sales page.
So the number is never the question. The measurement behind the number is the question, and the break-even line — set by your payout, not by the vendor's — is the bar it has to clear.
The bottom line
You arrived with
“a bot advertising 70%, 85% or 91% accuracy on Olymp Trade”
and you leave with
the questions that decide whether any such figure carries information.
A percentage is a claim about a measurement — so ask what was measured
Accuracy is never a property of the software alone: it belongs to a bot, an instrument, an expiry, a session, a period and a payout, together. Get those six named and you can check the claim; leave any of them out and there is nothing to check. Then run the only comparison that matters — the claimed win rate against the break-even line your own payout sets — and treat whatever survives as one input to confirm, sized for the losing streak rather than the average.
Can a bot predict the next candle on Olymp Trade with certainty?
No — and no legitimate tool claims it can. A prediction model outputs a frequency drawn from historical situations it judged similar to the present one. That frequency can be genuinely informative under stated conditions and still be wrong on any individual trade, because the market that produces the next candle has no knowledge of, and no obligation toward, the model's dataset.
What win rate does a prediction bot need just to break even?
More than half, always, and exactly how much more depends on your payout. Because a winner returns less than a loser costs on a fixed-time contract, the break-even point is one divided by one-plus-the-payout — roughly 55.6% at an 80% payout and roughly 52.6% at a 90% payout. Any claimed accuracy has to be compared against that line, not against 50%.
Are backtested accuracy figures worthless, then?
Not worthless — just weaker evidence than they look. A backtest run on data the rules were never tuned against, with realistic assumptions and the losing trades visible, is genuine information about how a rule set behaves. What makes a backtest misleading is optimising on the same stretch of history you then quote, or testing on indicators that redrew their own past. Treat a backtest as a reason to run a forward test, never as a substitute for one.
Should I trust a prediction bot on weekend OTC assets?
Treat it as a separate, untested instrument unless the vendor measured it there specifically. Weekend fixed-time instruments are quoted differently from exchange-hours instruments, so a pattern learned during the London session is being applied to a different price-generating process. If the claimed accuracy never mentions which hours it covers, assume it does not cover those.
How many of my own trades do I need before my test means anything?
Enough that a run of luck cannot explain the result — which is far more than most people log before deciding. A few dozen trades will comfortably produce a flattering win rate by chance alone, so keep collecting on demo until your sample is large enough that the number stops swinging when you add ten more trades. The moment it stabilises near or below your break-even line, you have your answer.
Sources & Further Reading
Want to go deeper? These independent, authoritative sources shaped this guide — each one is worth reading in full:
The Binary Options Desk is the SignalBots editorial team for fixed-time and OTC trading coverage. We research and write the guides that explain expiry timing, payout structure and disciplined entry across the major brokers.



Discussions 0
Leave a comment