You watched price spike straight through the morning high, stop out every short in the room, and then collapse just as fast — and you were on the wrong side of both moves. That whipsaw is not random noise. In the ICT framework it has a name and a repeatable shape: the Venom model. Once you can see it, that same raid that just cost you a stop becomes the thing you're waiting for.
This is an original explainer of how the setup works — the market logic behind it, the exact conditions that make it valid, and the times it will never appear. It builds on concepts that are taught publicly (opening range, liquidity, fair-value gaps), but the goal here is simple: give you a clear, honest map you can actually reason from, without the mystique.
The short answer
What is the ICT Venom model?
A liquidity raid
MarketIndex futures & FX intraday
SessionUS open, after 09:30 NY
Reference range08:00–09:30 NY (90 min)
Setup classOpening-range reversal
An original SignalBots explainer of a publicly taught concept
The Venom is a raid: price runs up to grab stops (the spike), then reverses — the sparkline traces that pop-and-drop shape.
Key Takeaways
The Venom model is an opening-range reversal: in a market already biased one way, price first raids the opposite side's liquidity, leaves a candle inside that pool, then runs away — that round-trip is the "venom."
It only appears with a pre-set directional bias and a clean 90-minute buy-side/sell-side map (08:00–09:30 NY). In a choppy, rangebound session the setup simply does not form — forcing it is the classic failure.
Entry is off the fair-value gap left by the displacement, stop sits beyond the sweep wick, and the first target is the opposite extreme of the 90-minute range — a defined reward-to-risk trade, not a guaranteed one.
Table of Contents (31 min read)Contents
Watch the original video
What the Venom Model Actually Is
Strip away the name and the Venom model is one idea: in a session that is already leaning one direction, the market makes its first move against that lean to collect the liquidity sitting there, then turns and delivers in the intended direction.
Think of a morning where the broader context is bearish — a sharply lower open, a heavy backdrop, whatever has the day predisposed to sell. Common sense says "it's going down." But before it goes down, price often pushes up first. Why? Because above the recent highs sit the buy stops of everyone who shorted early. Grabbing those stops lets larger participants sell into that demand and load their short positions at a better price. Only after that raid does the market roll over toward its real objective.
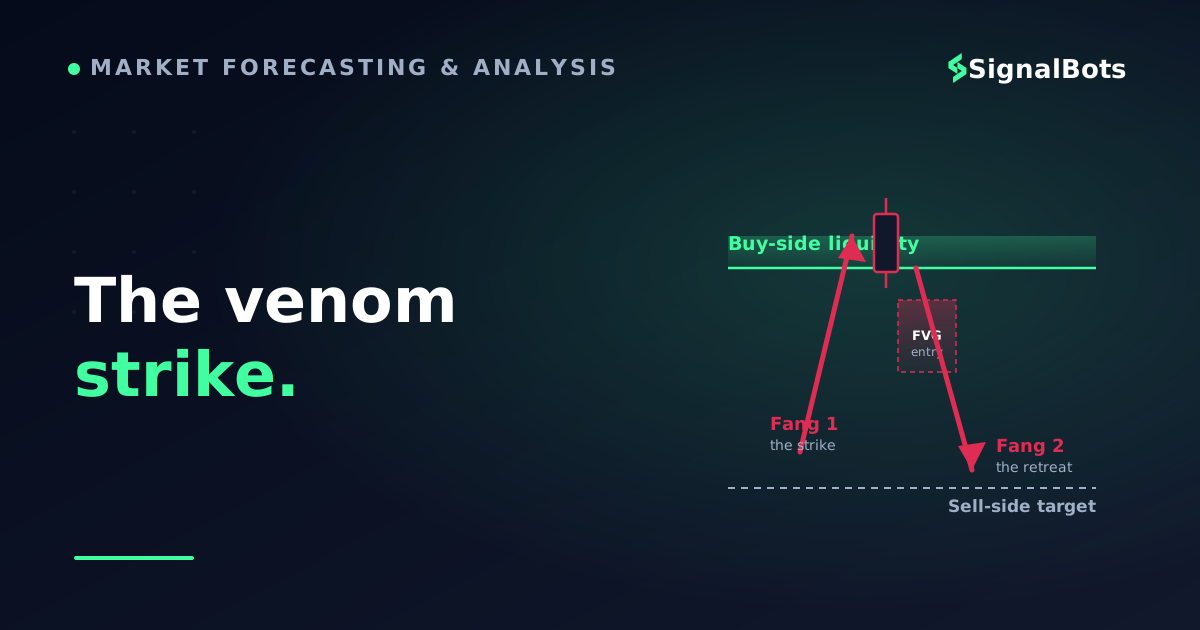
That round-trip — an aggressive push up into a pool of resting orders, a candle left inside that pool, and an equally aggressive drop away from it — is the signature. Price behaves like a snake: it strikes up, injects the venom (poisons the traders caught on the wrong side), and retreats. Reverse everything for a bullish day: the raid happens below the lows into resting sell stops, then price runs up.
This is why it isn't just "a stop hunt." A stop hunt is a description; the Venom model is a framed setup with a defined reference range, a defined trigger, and a defined target — which is what makes it something you can wait for instead of something that happens to you. If you're new to why resting orders above old highs are such a magnet, our glossary entry on liquidity covers the concept in one page.
The 90-Minute Liquidity Map (08:00–09:30 NY)
Before the model can trigger, you need a map of where the liquidity is. The Venom model builds that map from a single, very specific window: the 90 minutes before the regular US open, from 08:00 to 09:30 New York time — the electronic-trading session that runs ahead of the cash market.
Inside that window you mark two levels and only two:
The high of the 08:00–09:30 range — this is your buy-side liquidity. Buy stops rest above it.
The low of the same range — this is your sell-side liquidity. Sell stops rest below it.
That's the whole framework. Above the high is buy-side, below the low is sell-side. It is deliberately unambiguous — no interpretation, no drawing five different levels and picking your favourite after the fact. You define both edges before 09:30, then watch how price reacts to them once the session opens.
One clarification that trips people up: this is not "90-minute cycles" or any recurring-clock theory. It is one specific 90-minute lookback that sets the reference frame for the opening hour of trading. Its job is to tell the opening-range move which pools it is likely to reach for first.
Timing the window
Where the Venom window sits24-hour clock · times in UTC
UTC timeline
TokyoAsiaLondonGMT/BSTVenom window08:00–09:30 NYNew YorkUS cash open
0:00–9:000:00
7:00–16:007:00
12:00–14:0012:00
13:00–22:0013:00
000306091215182124
US open13:00–17:00 UTC · Where the raid plays out
Tokyo
London
Venom window
New York
Overlap (peak liquidity)
The 90-minute reference range (08:00–09:30 NY, shown here in UTC) is set inside the London/New York overlap, when liquidity is deep enough for a clean sweep to form. The raid itself plays out after the 09:30 cash open.
Mark the high and low of the pre-open 90-minute range; the model triggers in the hour after the US cash open.
The Directional Bias Comes First
Here is the part most people skip, and it is the part that decides whether the setup exists at all. The Venom model needs a pre-existing directional bias. It is a reversal within a lean, not a coin-flip at the range edge.
The logic follows directly from what the setup does. If the day is biased lower, the market's first job is to unseat the early shorts — so it raids the buy-side (the range high) first, then delivers down. If the day is biased higher, it raids the sell-side (the range low) first, then delivers up. The bias tells you which pool gets hit first and which direction you're ultimately trading.
So your workflow has an order to it:
Decide the session's likely direction from higher-timeframe context (where the weekly or daily draw on liquidity sits).
If you're bearish, watch only the buy-side raid at the range high. If you're bullish, watch only the sell-side raid at the range low.
Ignore the opposite edge — it is not your trade today.
Strip the bias out and you have nothing to trade. A push through the high with no reason to expect a reversal is just a breakout. What makes it Venom is that the raid runs counter to a direction you already had a reason to expect — the pool it hits is exactly the one whose traders are about to be poisoned.
The Two-Fang Signature: How a Valid Setup Looks
Once price reaches your chosen pool, you're looking for a very specific print. Not just a tag of the level — a particular shape. This is the confirmation that separates a real Venom from a level that simply got touched.
It comes in two parts, the two "fangs":
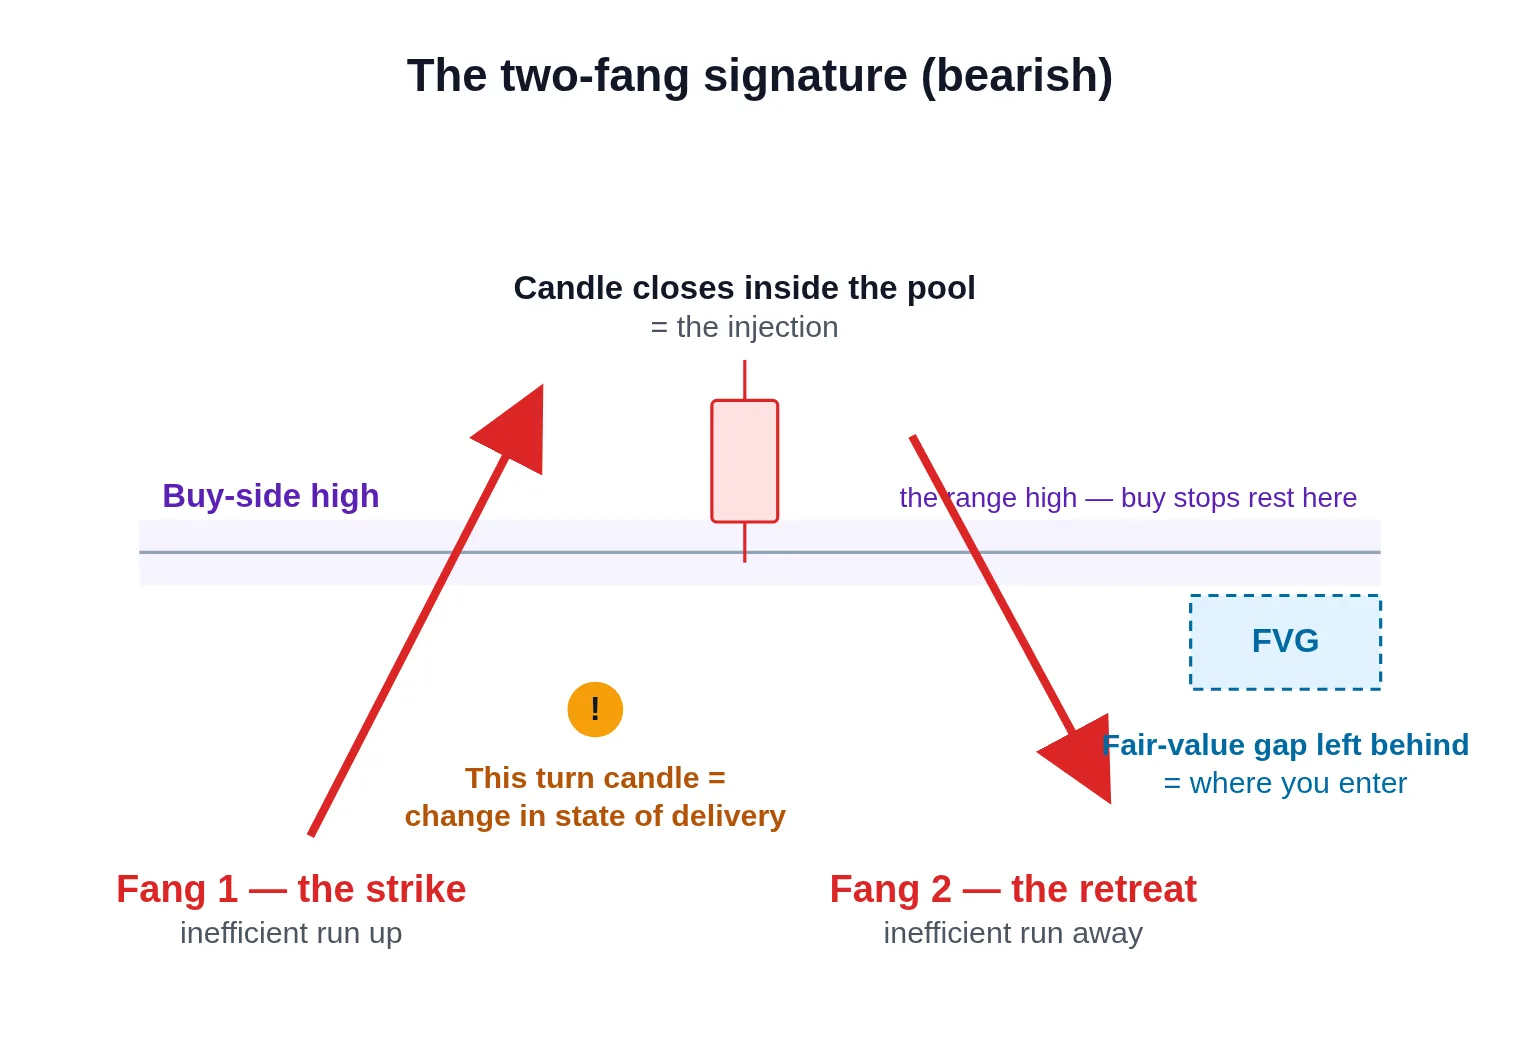
Fang one — the strike. Price runs inefficiently (a fast, one-sided candle) up through the relevant equal highs and closes a candle above them, leaving that candle's body inside the pool of liquidity. This is the injection — the buy stops get triggered, and larger sellers step in as the counterparty.
Fang two — the retreat. The very next candle breaks back down inefficiently and closes below, leaving an imbalance (a fair-value gap) on both sides of the strike. Price introduced itself to the liquidity, poisoned it, and left fast.
Those two inefficient legs — the run to the pool and the run away from it — are the whole tell. The candle that pierced the highs, whose close marks the turn, is the change in the state of delivery: the moment the market stops being a buyer and becomes a seller. It is what you build your entry around. (Flip the colours and the description for a bullish setup at the sell-side.)
The two-fang signature: price strikes up into buy-side liquidity, leaves a candle inside the pool, then retreats fast — the run-away leaves the fair-value gap you enter from.
Below is that signature drawn on a bearish example: the pre-open range, the two levels, the strike above the buy-side high, and the retreat that leaves the fair-value gap you'll trade from.
The setup on a chart
A bearish Venom on the opening rangeUS1001m
Price raids the buy-side high, closes a candle inside the pool, then runs away leaving a fair-value gap. Entry is on the return to that gap; the stop sits just beyond the sweep; the first target is the opposite (sell-side) extreme of the range.
The two-fang signature: a sweep of buy-side liquidity, then an inefficient reversal that hands you the entry, risk, and reward.
Entry, Stop, and Target
With the signature confirmed, the trade itself is mechanical. There are two ways to get in, trading off the change in the state of delivery:
The lower-risk entry waits for price to trade back into the fair-value gap left by the retreat (the imbalance from fang two) — often the open of the turn candle, sometimes the first fair-value gap the displacement leaves behind. You enter on that retest.
The higher-conviction entry takes the level as price runs into it, without waiting for the pullback. It needs more certainty about the bias, because you're front-running the retest.
Your stop-loss goes just beyond the sweep wick — above the raided high on a bearish setup, below the raided low on a bullish one. If the level that was supposed to reject gets cleanly reclaimed, the premise is wrong and you're out. Keep the stop tight to structure; a wide stop here usually means you mis-marked the range.
The first take-profit is the opposite extreme of the 90-minute range — the sell-side low on a bearish trade, the buy-side high on a bullish one. That opposite pool is the natural draw once the poison is delivered, because the liquidity resting there is the market's next objective.
Because the entry, stop, and target are all defined by structure, every Venom trade has a knowable reward-to-risk ratio before you click. That is the honest way to judge it — not by a win-rate number, which is meaningless without the reward-to-risk behind it and a real sample of trades. And because the stop distance is fixed by the sweep wick, let that distance set your position size: risk a constant fraction of your account per trade, and the tight, structural stop the model gives you does the sizing for you instead of your emotions.
The whole model in five steps
The five conditions of a valid Venom setup
1
1. Establish a directional bias
From higher-timeframe context, decide the session's likely direction before the open. No bias, no setup.
2
2. Map the 90-minute range
Mark the high (buy-side) and low (sell-side) of the 08:00–09:30 NY window. These are your only two levels.
3
3. Watch the correct pool
Bearish? Watch the buy-side high for the raid. Bullish? Watch the sell-side low. Ignore the other edge.
4
4. Confirm the two fangs
An inefficient strike closes a candle inside the pool, then an inefficient retreat leaves a fair-value gap.
5
5. Enter, stop, target
Enter on the FVG retest, stop beyond the sweep wick, first target the opposite extreme of the range.
Follow the order. The bias and the range map come before any trigger — skip them and you're guessing, not trading Venom.
When the Venom Model Does NOT Appear
This is the discipline that keeps the model honest. The Venom is not a pattern you can hunt for on any chart at any time — it only exists inside a specific market condition, and forcing it where that condition is absent is the single most common way traders lose money with it.
The setup needs a market that is predisposed to go one direction. Its entire premise is unseating traders who would otherwise be positioned correctly — which requires there to be a clear lean for them to be positioned with. In the middle of a choppy, rangebound session that has already printed several large candles up and down with no bias, that premise evaporates. The pool raid doesn't mean anything, because there's no directional delivery waiting on the other side of it.
So two hard filters:
No bias, no trade. If you can't state the day's likely direction and why, you have no Venom setup — you have a level that price touched.
No clean range, no trade. If the 08:00–09:30 window is a mess of overlapping wicks with no definable high and low, the map is unreliable and the model doesn't apply.
And sometimes price simply won't reach your level, or it starts running before the raid forms. That's fine — you don't force it. You either stand aside for the next opportunity or you fall back on a different, unrelated setup. Missing a trade is not a loss; manufacturing one out of a session that never offered it is.
Check yourself
Knowledge check
A choppy, rangebound session has printed several big candles up and down with no clear bias. Price now sweeps the 90-minute range high. Is this a Venom setup?
Why
The Venom model is a reversal within a directional lean — it works by unseating traders who are positioned with that lean. In a rangebound session with no bias, there is no intended delivery on the other side of the raid, so a sweep means nothing. Forcing the setup here is the classic failure. (And it trades whichever pool is opposite the bias — buy-side when bearish, sell-side when bullish — so the last option is wrong too.)
The context filter matters more than the pattern. When in doubt, no bias means no trade.
From Reading the Setup to Acting on It
Seeing the Venom in hindsight is easy. Catching it live is hard, because the whole thing resolves in the first hour after the open, the strike-and-retreat can print in two candles, and the entry window on the fair-value gap is narrow. By the time you've confirmed both fangs by eye and drawn your levels, the retest is often already gone.
This is exactly the kind of condition-based setup that suits rule automation. Every element of a valid Venom is objective: a defined range, a sweep of a specific level, a candle closing back inside, an imbalance on the follow-through, a bias filter you set in advance. Those are conditions a scanner or an alert can watch far faster and more patiently than you can — turning the setup into a trading signal the instant it prints, so you're deciding on the trade instead of hunting for it.
If you want to watch these liquidity raids get flagged in real time rather than chart them by hand, our ICT liquidity-grab scanner for TradingView marks buy-side and sell-side sweeps as they happen, and a trading-session filter keeps it looking only inside your chosen window. It won't decide your bias for you — that judgement stays with you, and a scanner that fires outside a real directional lean will still hand you the choppy-market false positives from the last section. Used as an alert layer on top of your own read, though, it turns "I missed it again" into "I got pinged the moment it formed." You can activate the scanner with a free lifetime license. It isn't for everyone: if you're still learning to mark the range and read the two fangs by eye, keep charting by hand until the pattern is second nature — an alert on a setup you can't yet recognise just makes bad reads faster.
FAQ
What is the ICT Venom model in simple terms?
It's an opening-range reversal. In a session already leaning one direction, price first raids the opposite side's resting stop orders — the "liquidity" — leaves a candle inside that pool, then reverses hard toward its real objective. That sweep-and-reverse round-trip is the "venom": it poisons the traders caught on the wrong side.
What time window does the Venom model use?
The reference range is the 90 minutes before the regular US open — 08:00 to 09:30 New York time, the electronic session ahead of the cash market. You mark the high and low of that window; the setup then triggers in the opening hour after 09:30.
What are the "two fangs"?
They are the two inefficient (fast, one-sided) legs that confirm a valid setup: fang one is the strike — price runs into the liquidity pool and closes a candle inside it; fang two is the retreat — the next candle runs away and leaves a fair-value gap. The candle whose close marks the turn is your entry reference.
Where do the stop and target go?
The stop sits just beyond the sweep wick (above the raided high on a bearish trade, below the raided low on a bullish one). The first target is the opposite extreme of the 90-minute range — the pool of liquidity on the other side, which becomes the market's next draw.
Why does the Venom model sometimes not appear?
Because it needs a directional bias. The setup works by unseating traders positioned with a lean, so in a choppy, rangebound session with no bias there's nothing on the other side of the raid — and it won't form. Forcing it in those conditions is the most common way traders lose with it.
Can the Venom model be automated?
The trigger conditions are objective — a defined range, a sweep of a specific level, a candle closing back inside, an imbalance on the follow-through — so a scanner or alert can flag them in real time. The bias still needs your judgement, so automation works best as an alert layer on top of your own read, not a hands-off system.
Sources & Further Reading
Want to go deeper? These independent, authoritative sources shaped this guide — each one is worth reading in full:
The Forex Desk is the SignalBots editorial team responsible for our currency-market coverage. We research and write the guides, explainers and reference articles on how the majors, minors and crosses actually trade — sessions, spreads, swaps and the macro releases that move price.
Want to use the bot without paying? Message our 24/7 support team via Telegram or Viber. Our experts will guide you step-by-step on how to unlock your free lifetime license through our exclusive broker partnership program.



Discussions 0
Leave a comment