Crypto Signals

Solana (SOL/USD) Trading Signals

Real-time Solana (SOL/USD) signals with a full trade plan: entry, stop-loss, and take-profit targets, delivered in under 10ms on the web, Telegram, our browser extension and mobile app.

Live Signals
LIVE Last Solana (SOL/USD) signal 0 active now
Performance

Recent Results

Per-symbol net percentage outcome by day across the last 30 trading sessions. Filter to a symbol to isolate its track.

Monthly Summary Click to toggle
Month, Year Total (Net %) SOL/USD
Month-to-date 88.0 88.0
October 2026 328.0 328.0
September 2026 291.0 291.0
August 2026 127.0 127.0
July 2026 37.0 37.0

Disclaimer: Past performance does not guarantee future results, and the results shown here represent historical outcomes only and may not be repeated. Please trade and invest with caution; the information provided is for informational purposes only and does not constitute investment or trading advice.

Direction
Get every Solana (SOL/USD) signal instantly Web, Telegram, browser extension, and mobile app, all included on any plan.
SOL/USD 5 Minutes
Sell
Entry 86.6500
Stop Loss 87.1589
TP1 86.1411
TP2 85.6322
TP3 85.1234
TP4 84.6145
TP1 Hit #132311
SOL/USD 30 Minutes
Sell
Entry 87.8000
Stop Loss 89.3553
TP1 86.2447
TP2 84.6895
TP3 83.1342
TP4 81.5790
TP1 Hit #132180
SOL/USD 5 Minutes
Buy
Entry 90.1700
Stop Loss 89.8506
TP1 90.4894
TP2 90.8087
TP3 91.1281
TP4 91.4475
TP1 Hit #131915
SOL/USD 1 Hour
Sell
Entry 90.7500
Stop Loss 91.7652
TP1 89.7348
TP2 88.7196
TP3 87.7044
TP4 86.6892
TP4 Hit #131875
SOL/USD 1 Minute
Buy
Entry 90.4300
Stop Loss 90.3201
TP1 90.5399
TP2 90.6497
TP3 90.7596
TP4 90.8695
TP4 Hit #131833
SOL/USD 1 Minute
Sell
Entry 89.7800
Stop Loss 89.9753
TP1 89.5847
TP2 89.3895
TP3 89.1942
TP4 88.9989
TP4 Hit #131763
SOL/USD 1 Minute
Sell
Entry 96.5200
Stop Loss 96.6181
TP1 96.4219
TP2 96.3238
TP3 96.2257
TP4 96.1276
TP4 Hit #131603
SOL/USD 5 Minutes
Buy
Entry 95.8800
Stop Loss 95.7040
TP1 96.0560
TP2 96.2320
TP3 96.4079
TP4 96.5839
TP4 Hit #131552
SOL/USD 4 Hours
Sell
Entry 94.5100
Stop Loss 98.4359
TP1 90.5841
TP2 86.6581
TP3 82.7322
TP4 78.8062
TP2 Hit #131468
Trade Ledger

Last 20 Signals

Date, time Order Price Take Profit Stop Loss State Entry Exit Profit
November 9, 2026 at 7:50 PM GMT Nov 9, 26 19:50 GMT Sell 86.6500 86.1411, 85.6322, 85.1234, 84.6145 87.1589 TP1 Hit 86.6500 86.1411 +5089
November 9, 2026 at 2:00 AM GMT Nov 9, 26 02:00 GMT Sell 87.8000 86.2447, 84.6895, 83.1342, 81.5790 89.3553 TP1 Hit 87.8000 86.2447 +15553
November 6, 2026 at 8:00 PM GMT Nov 6, 26 20:00 GMT Buy 90.1700 90.4894, 90.8087, 91.1281, 91.4475 89.8506 TP1 Hit 90.1700 90.4894 +3194
November 6, 2026 at 4:00 PM GMT Nov 6, 26 16:00 GMT Sell 90.7500 89.7348, 88.7196, 87.7044, 86.6892 91.7652 TP4 Hit 90.7500 86.6892 +40608
November 6, 2026 at 12:00 PM GMT Nov 6, 26 12:00 GMT Buy 90.4300 90.5399, 90.6497, 90.7596, 90.8695 90.3201 TP4 Hit 90.4300 90.8695 +4395
November 6, 2026 at 4:00 AM GMT Nov 6, 26 04:00 GMT Sell 89.7800 89.5847, 89.3895, 89.1942, 88.9989 89.9753 TP4 Hit 89.7800 88.9989 +7811
November 5, 2026 at 12:00 PM GMT Nov 5, 26 12:00 GMT Sell 96.5200 96.4219, 96.3238, 96.2257, 96.1276 96.6181 TP4 Hit 96.5200 96.1276 +3924
November 5, 2026 at 7:55 AM GMT Nov 5, 26 07:55 GMT Buy 95.8800 96.0560, 96.2320, 96.4079, 96.5839 95.7040 TP4 Hit 95.8800 96.5839 +7039
November 4, 2026 at 8:00 PM GMT Nov 4, 26 20:00 GMT Sell 94.5100 90.5841, 86.6581, 82.7322, 78.8062 98.4359 TP2 Hit 94.5100 86.6581 +78519
November 4, 2026 at 7:50 AM GMT Nov 4, 26 07:50 GMT Buy 93.2200 93.7340, 94.2480, 94.7620, 95.2759 92.7060 TP1 Hit 93.2200 93.7340 +5140
November 3, 2026 at 8:00 PM GMT Nov 3, 26 20:00 GMT Sell 93.2800 93.2330, 93.1860, 93.1389, 93.0919 93.3270 TP1 Hit 93.2800 93.2330 +470
November 3, 2026 at 12:00 AM GMT Nov 3, 26 00:00 GMT Buy 91.9800 92.0568, 92.1336, 92.2105, 92.2873 91.9032 TP4 Hit 91.9800 92.2873 +3073
October 31, 2026 at 4:00 PM GMT Oct 31, 26 16:00 GMT Buy 95.9800 96.0250, 96.0700, 96.1151, 96.1601 95.9350 TP4 Hit 95.9800 96.1601 +1801
October 31, 2026 at 4:00 AM GMT Oct 31, 26 04:00 GMT Sell 96.2600 95.2846, 94.3092, 93.3338, 92.3584 97.2354 TP4 Hit 96.2600 92.3584 +39016
October 30, 2026 at 8:00 PM GMT Oct 30, 26 20:00 GMT Buy 94.7900 94.9010, 95.0121, 95.1231, 95.2341 94.6790 TP4 Hit 94.7900 95.2341 +4441
October 30, 2026 at 12:05 PM GMT Oct 30, 26 12:05 GMT Sell 96.6300 96.0640, 95.4980, 94.9320, 94.3661 97.1960 TP4 Hit 96.6300 94.3661 +22639
October 27, 2026 at 12:25 AM GMT Oct 27, 26 00:25 GMT Sell 100.9300 100.6849, 100.4399, 100.1948, 99.9498 101.1751 TP4 Hit 100.9300 99.9498 +9802
October 26, 2026 at 8:00 AM GMT Oct 26, 26 08:00 GMT Sell 100.7200 100.6084, 100.4968, 100.3853, 100.2737 100.8316 TP4 Hit 100.7200 100.2737 +4463
October 26, 2026 at 12:00 AM GMT Oct 26, 26 00:00 GMT Sell 101.4000 101.0673, 100.7346, 100.4018, 100.0691 101.7327 TP4 Hit 101.4000 100.0691 +13309
October 24, 2026 at 12:00 AM GMT Oct 24, 26 00:00 GMT Sell 102.8500 102.5853, 102.3205, 102.0558, 101.7911 103.1147 TP3 Hit 102.8500 102.0558 +7942
FAQs

Common questions about Solana (SOL/USD) signals

How fast do signals reach me?

Every signal pushes to you in under 10 milliseconds from when our engine fires. It lands on the web dashboard, Telegram, our browser extension, and the mobile app at the same time, so you never miss an entry.

What crypto markets do you cover?

Every crypto instrument with a live track record shows up as a card on this page, busiest first. Tap any card to open its full signal history.

What's inside each signal?

A clear direction (Buy or Sell), an entry price, a protective stop loss, and take-profit targets, plus a live status that updates as the trade plays out.

How should I size each trade?

We suggest risking 1–2% of your account per trade. Your position size then follows from the stop distance on each signal and the risk percentage you're comfortable with.

Where can I see past results?

Right on this page: the Recent Results chart and the full statistics panel above show every tracked outcome. We publish the complete record, wins and losses alike.

How will I receive signals?

Through whichever channels suit you: the web dashboard, Telegram, our browser extension, and the mobile app all stay in sync, so each signal reaches you wherever you are.

How do I get VIP access?

VIP access comes with every plan; message our team and we'll set you up.

Do you guarantee profits?

No, and be wary of anyone who does. Crypto trading carries substantial risk. Read our Risk Warning and judge the historical edge for yourself before subscribing.

Can I cancel any time?

Yes. Cancel in one click from your dashboard, no hidden fees and no auto-renewal traps.

Still have questions?

Our team is happy to help before you join; get in touch and we'll walk you through anything you're unsure about.

Example signal card

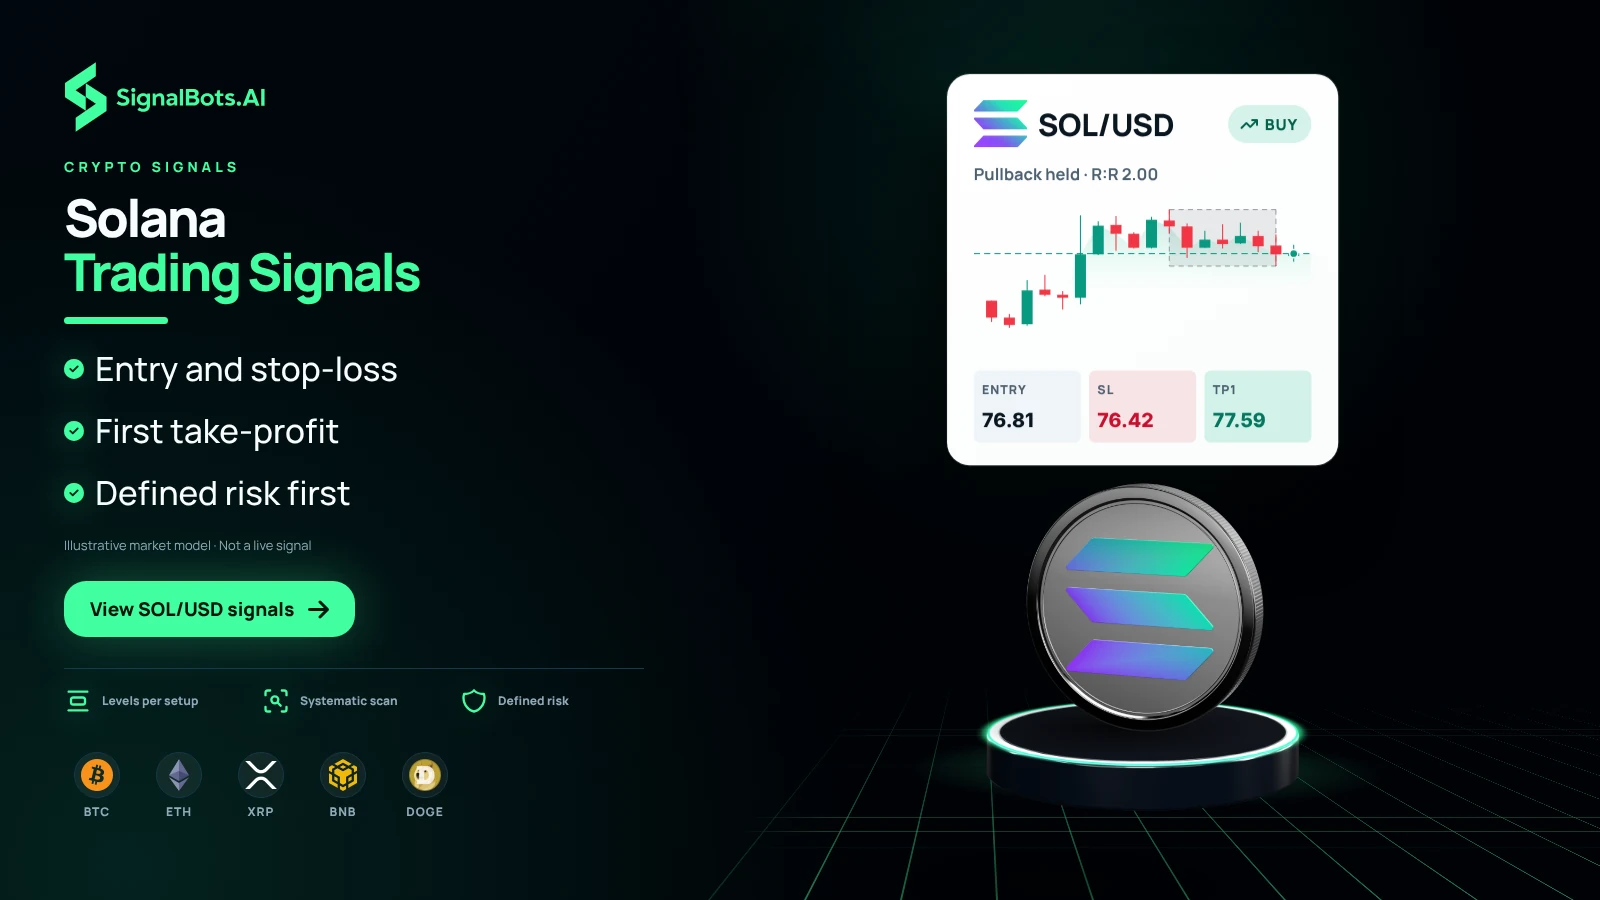
Solana Trading Signals with Entry, Stop Loss and First Take Profit

The example card shows how a Solana signal is laid out. This SOL/USD buy follows a pullback that held on its chart, then gives you the entry, the stop-loss and TP1, the first of four take-profits, as fixed prices. You know where the trade is wrong and what it risks before you place it. The same signals cover the other coins shown along the bottom: Bitcoin, Ethereum, XRP, BNB and Dogecoin. The card is an illustrative example, not a live signal.

Dark duotone image with the headline "Solana Trading Signals" beside an illustrative SOL/USD buy card reading "Pullback held", with a candlestick chart and entry 76.81, SL 76.42 and TP1 77.59 boxes, a Solana coin on a lit podium, and BTC, ETH, XRP, BNB and DOGE marks along the bottom.
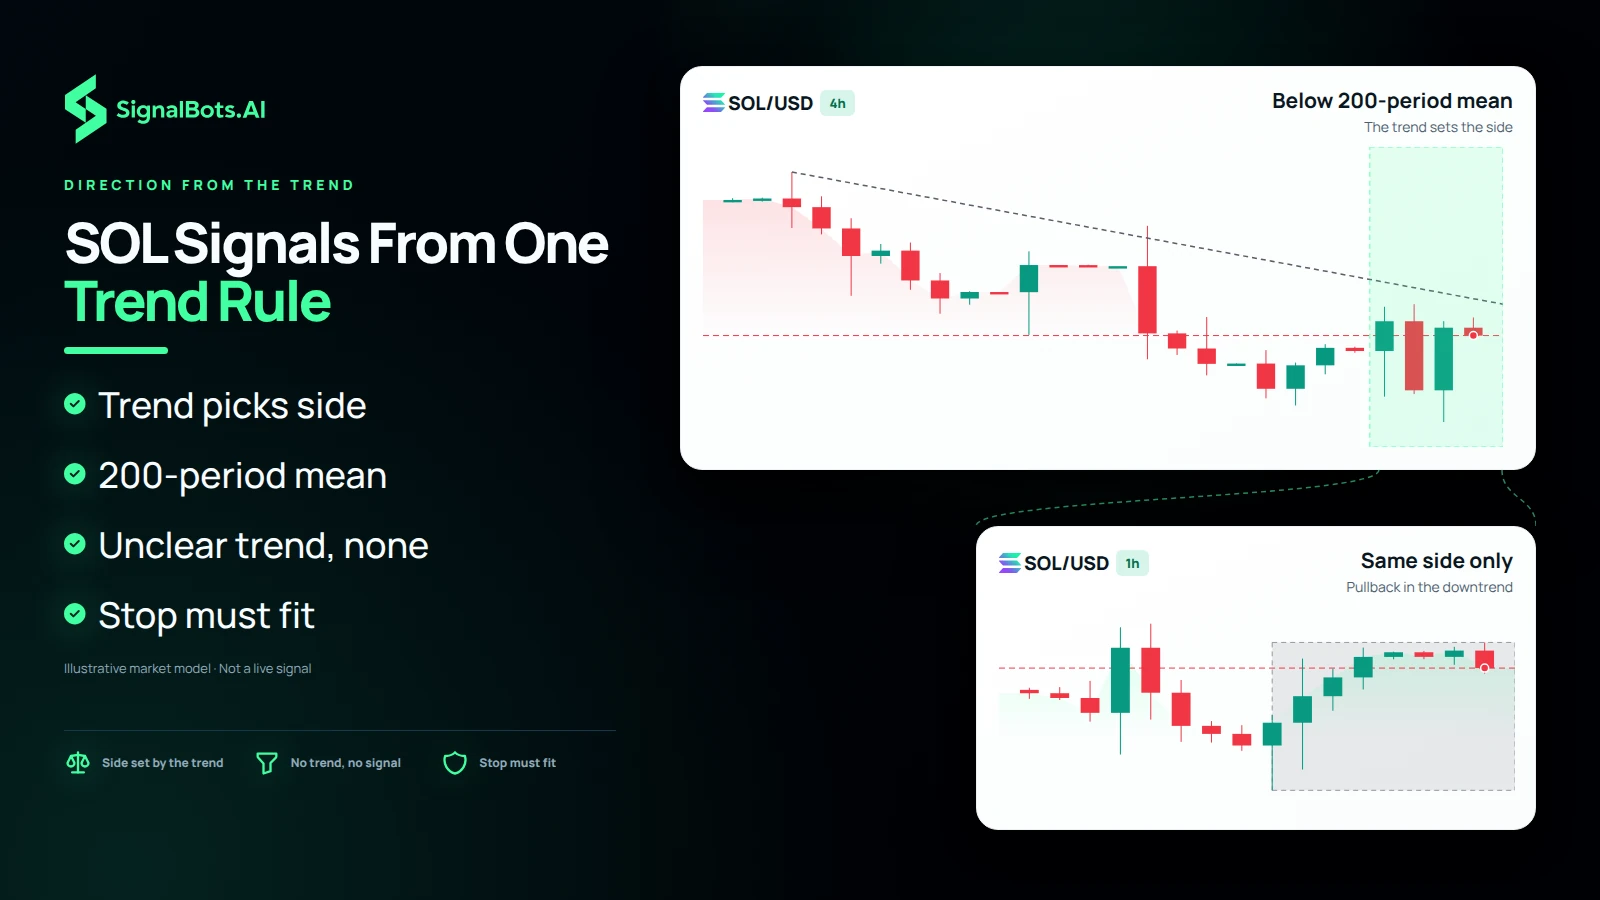
Duotone image headed "SOL Signals From One Trend Rule": a 4h SOL/USD chart labelled "Below 200-period mean" zooms into a 1h chart labelled "Same side only" with a pullback in the downtrend, beside points saying the trend picks the side, an unclear trend gives none, and the stop must fit.

Direction from the trend

Solana Buy and Sell Signals From One Trend Rule

A Solana buy signal appears only when price is above its 200-period average, and a sell signal only when it is below. That single rule decides the side of every SOL/USD setup, so you never get a buy against a clear downtrend just because a bounce looked tempting. When the trend is unclear or no sensible stop fits, there is no signal, and that is a common and deliberate outcome.

Fast-chart trade-offs

SOL Trading Signals Today on Short Timeframes

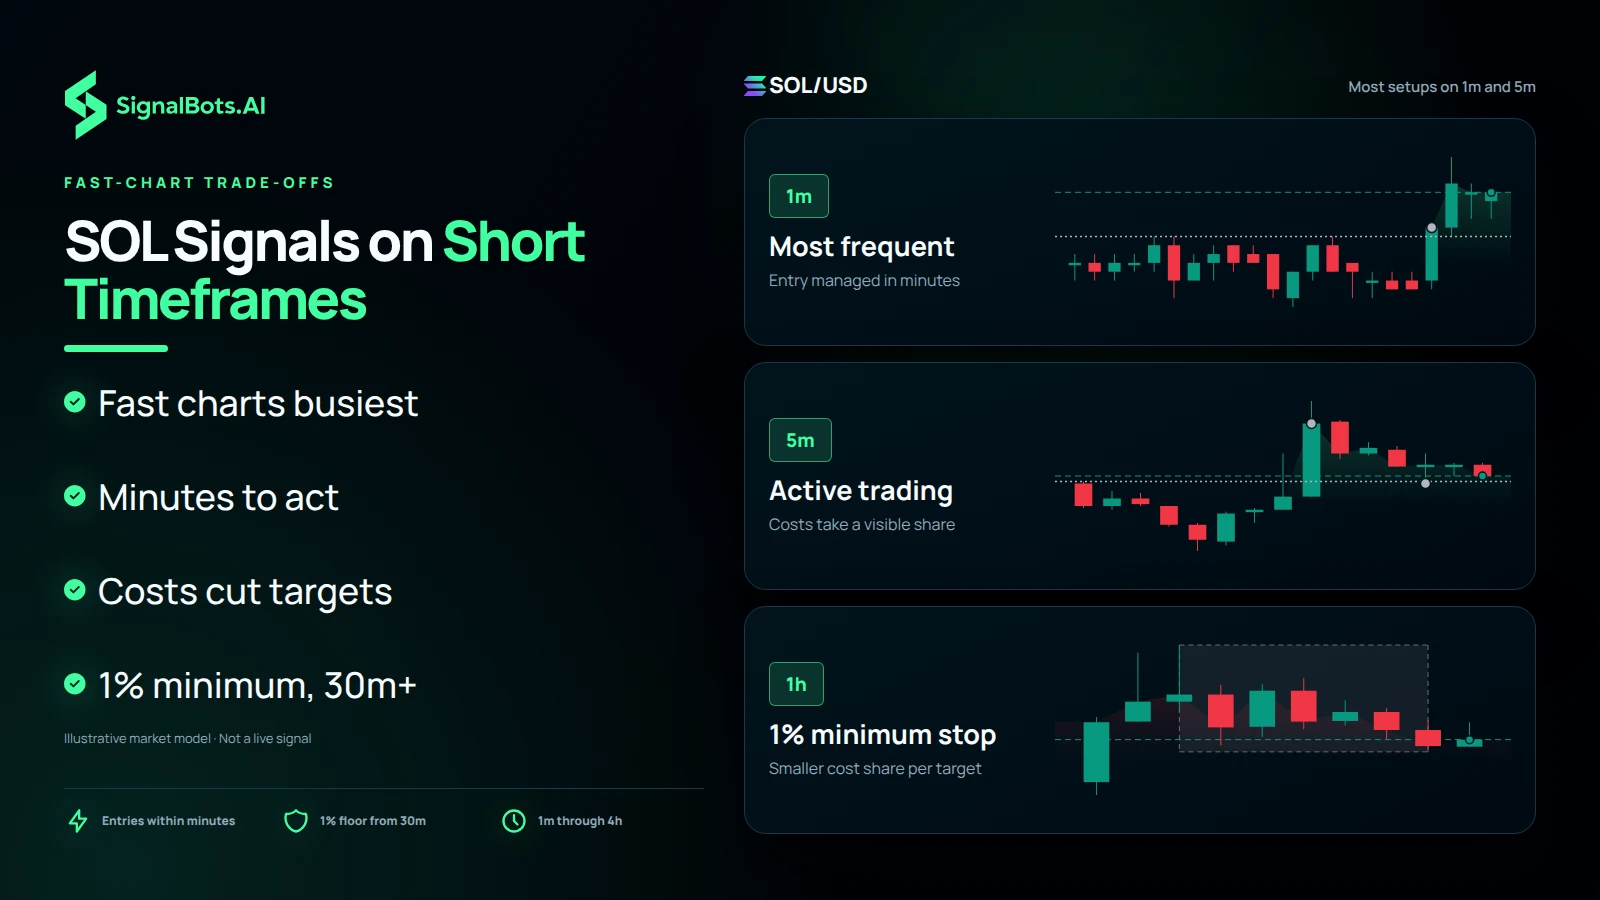
The 1m and 5m charts are where Solana setups appear most often, because the cost minimum is lifted there and short moves are traded. These suit active traders who can manage an entry within minutes. The trade-off is that fees and spread take a visible share of each target at that size, so a realised result usually trails the planned one more than on the 30m, 1h or 4h charts, where every stop must clear 1% of price.

Dark image headed "SOL Signals on Short Timeframes" stacks three SOL/USD charts: 1m "Most frequent", 5m "Active trading" where costs take a visible share, and 1h "1% minimum stop", beside points on fast charts being busiest, minutes to act, costs cutting targets and the 1% minimum from 30m.
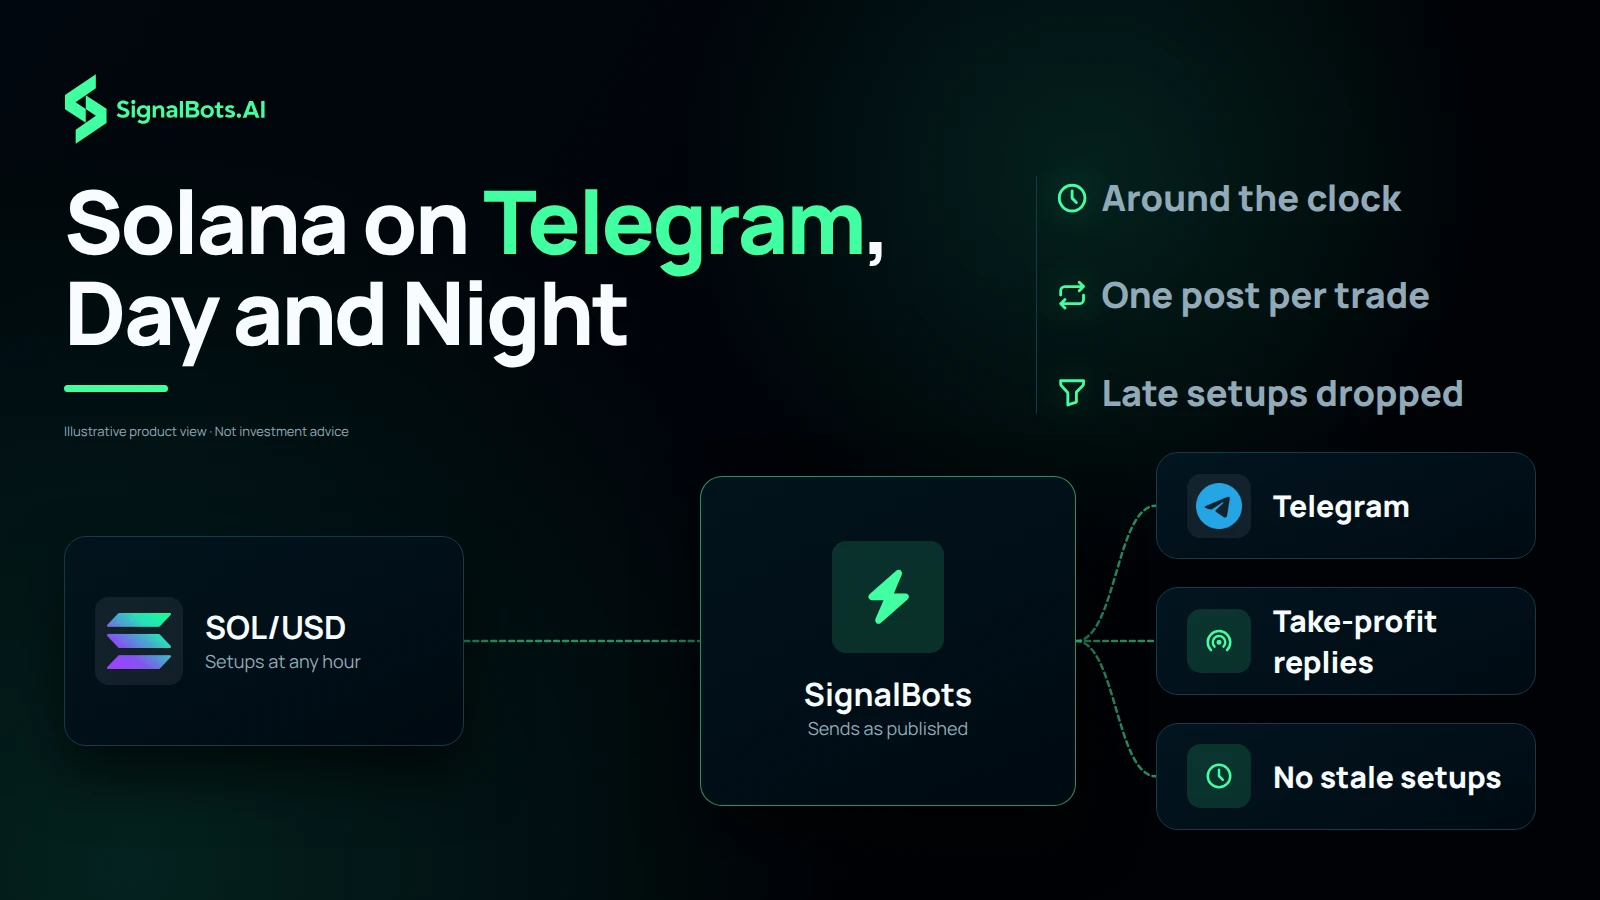
Dark flow diagram headed "Solana on Telegram, Day and Night": a SOL/USD card reading "Setups at any hour" feeds a SignalBots hub that sends as published to Telegram, take-profit replies and no stale setups, with around the clock, one post per trade and late setups dropped listed beside the headline.

Telegram delivery

Solana Signals on Telegram, Day and Night

Solana does not keep office hours, and neither does its signal feed. New SOL/USD setups go to Telegram as they are published, and every take-profit reached is added underneath as a reply. Nothing older than three candles is sent, so a fast 1m setup that could not be delivered in time simply does not appear, instead of arriving as an entry the market has already passed.

How trades are scored

Solana Signal Results You Can Audit

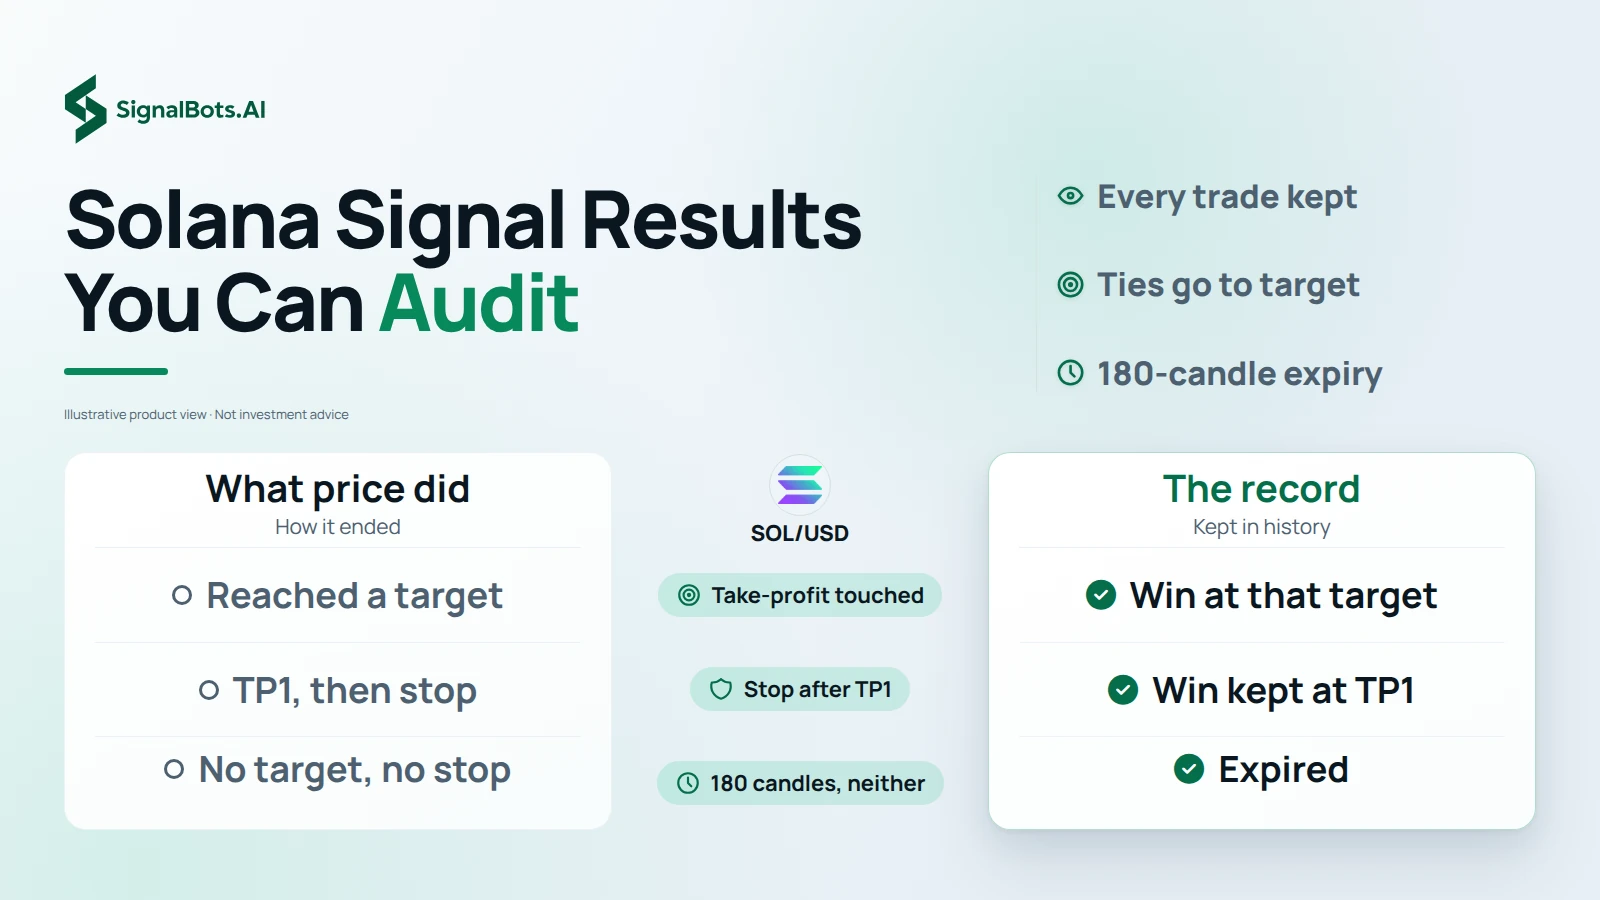
Every SOL/USD signal stays in the history with the way it ended: a take-profit touched, the stop hit, or expired after 180 candles without reaching either. When one candle touched both a target and the stop, the target is recorded, and a stop after TP1 keeps the win at TP1. Knowing those rules lets you read Solana's statistics for what they measure, rather than for what they might appear to promise.

Light comparison table headed "Solana Signal Results You Can Audit" under the SOL/USD mark sets what price did beside the record: take-profit touched as a win at that target, stop after TP1 as a win kept at TP1, and 180 candles without either as expired.

Win Rate

Wins vs losses
84%
Win Rate

Gain Chart

Cumulative growth over the last 120 days
Past performance is not indicative of future results. Crypto trading carries substantial risk. Review our Risk Warning before subscribing.
ROI Calculator

What if you traded with us?

Move the slider: see the cumulative return our tracked signals produced over the last 7 days, applied to your starting capital.

Starting $1,000
After last 7 days $1,760 +$760
Hypothetical, based on historical Win Rate. Not a guarantee of future returns.
+79.54%
Total Gain
0.0%
Max Drawdown
+$7953.7
Net Profit
Full Advanced Statistics Click to expand

Advanced Statistics

Updated Nov 10, 2026 · 03:22 GMT
Balance $17953.7
Equity (100.00%) $17953.7
Floating PL $0.0
Deposits $10000.0
Withdrawals $0
Trades 296
Pips 795370
Won 100%
Avg. Trade Time
Lots 38.48
Profit Factor 0.0
Daily 0.19%
Monthly 5.76%
Trades Per Month 21
Expectancy 26512.3 Pips / $265.12
Built for your exchange

Keep your exchange. Keep your edge.

No switching accounts, no relearning a platform. Whichever crypto exchange you already trade with, these signals plug straight in. Read them here, or let our extensions, robots and connectors act on them for you.

Trusted by traders

What Solana (SOL/USD) Traders Are Saying

A Solana (SOL/USD) trade plan I can check before acting

On the Crypto signals page, the Solana (SOL/USD) entry, stop and targets give me a defined checklist instead of a rushed decision.

Noura Al Qahtani
Noura Al Qahtani Saudi Arabia

Solana (SOL/USD) history makes the process easier to review

I use the Crypto Recent Results and Solana (SOL/USD) monthly table to study the setup before I decide whether it fits my own risk plan.

Cian Murphy
Cian Murphy Ireland

Solana (SOL/USD) levels help me avoid chasing

Seeing the Crypto Solana (SOL/USD) stop alongside the target keeps me patient when price is already moving quickly.

Amelia Evans
Amelia Evans United Kingdom

Solana (SOL/USD) context without hiding the risk

The Crypto Solana (SOL/USD) page makes the outcome history visible, so I can keep position size and risk limits under my own control.

Lukas Muller
Lukas Muller Germany

One focused view for Solana (SOL/USD)

The Crypto Solana (SOL/USD) alerts and symbol filters make it much easier to follow the instruments I actually trade.

Marlon Reyes
Marlon Reyes Philippines

Ready to trade Solana (SOL/USD) with us?

Full access to every signal, with instant alerts on the web, Telegram, our extension and mobile app.

No card needed
VIP Access $49/mo · 7-day free trial