Free WTI Brent Trading Signals

Live WTI and Brent crude signals — entry, stop-loss and take-profit on every oil setup, with status updates as each one plays out. Tap any symbol for its full history.

Live Signals
LIVE 3 instruments Last signal 6 active now
Performance

Recent Results

Per-symbol net pip outcome by day across the last 30 trading sessions. Filter to a symbol to isolate its track.

Monthly Summary Click to toggle
Month, Year Total (Pips) Brent Crude (UK Oil) WTI Natural Gas
Month-to-date 16,815.0 7,800.0 7,380.0 1,635.0
August 2026 6,540.0 2,685.0 2,535.0 1,320.0
July 2026 8,910.0 4,080.0 3,105.0 1,725.0
June 2026 7,545.0 2,895.0 3,105.0 1,545.0
May 2026 7,470.0 3,270.0 2,550.0 1,650.0

Disclaimer: Past performance does not guarantee future results, and the results shown here represent historical outcomes only and may not be repeated. Please trade and invest with caution; the information provided is for informational purposes only and does not constitute investment or trading advice.

UKOIL 5 Minutes
Sell
Entry 103.30
Stop Loss 103.48
TP1 103.12
TP2 102.95
TP3 102.77
TP4 102.60
TP2 Hit #122890
USOIL 1 Minute
Sell
Entry 95.68
Stop Loss 95.76
TP1 95.60
TP2 95.52
TP3 95.44
TP4 95.36
TP4 Hit #122888
NATGAS 5 Minutes
Buy
Entry 2.900
Stop Loss 2.891
TP1 2.909
TP2 2.917
TP3 2.926
TP4 2.934
VIP Clients Only
Active #122892
Get every signal instantly Web, Telegram, browser extension, and mobile app — all included on any plan.
FAQs

Frequently Asked Questions

How fast do signals reach me?

Every signal pushes to you in under 10 milliseconds from when our engine fires — it lands on the web dashboard, Telegram, our browser extension, and the mobile app at the same time, so you never miss an entry.

What WTI / Brent crude markets do you cover?

Every WTI / Brent crude instrument with a live track record shows up as a card on this page, busiest first. Tap any card to open its full signal history.

What's inside each signal?

A clear direction (Buy or Sell), an entry price, a protective stop loss, and take-profit targets — plus a live status that updates as the trade plays out.

How should I size each trade?

We suggest risking 1–2% of your account per trade. Your position size then follows from the stop distance on each signal and the risk percentage you're comfortable with.

Where can I see past results?

Right on this page — the Recent Results chart and the full statistics panel above show every tracked outcome. We publish the complete record, wins and losses alike.

How will I receive signals?

Through whichever channels suit you — the web dashboard, Telegram, our browser extension, and the mobile app all stay in sync, so each signal reaches you wherever you are.

How do I get VIP access?

VIP access comes with every plan — message our team and we'll set you up.

Do you guarantee profits?

No — and be wary of anyone who does. WTI Brent trading carries substantial risk. Read our Risk Warning and judge the historical edge for yourself before subscribing.

Can I cancel any time?

Yes. Cancel in one click from your dashboard — no hidden fees and no auto-renewal traps.

Still have questions?

Our team is happy to help before you join — get in touch and we'll walk you through anything you're unsure about.

Energy coverage

WTI Crude, Brent and Natural Gas Signals in One Energy Feed

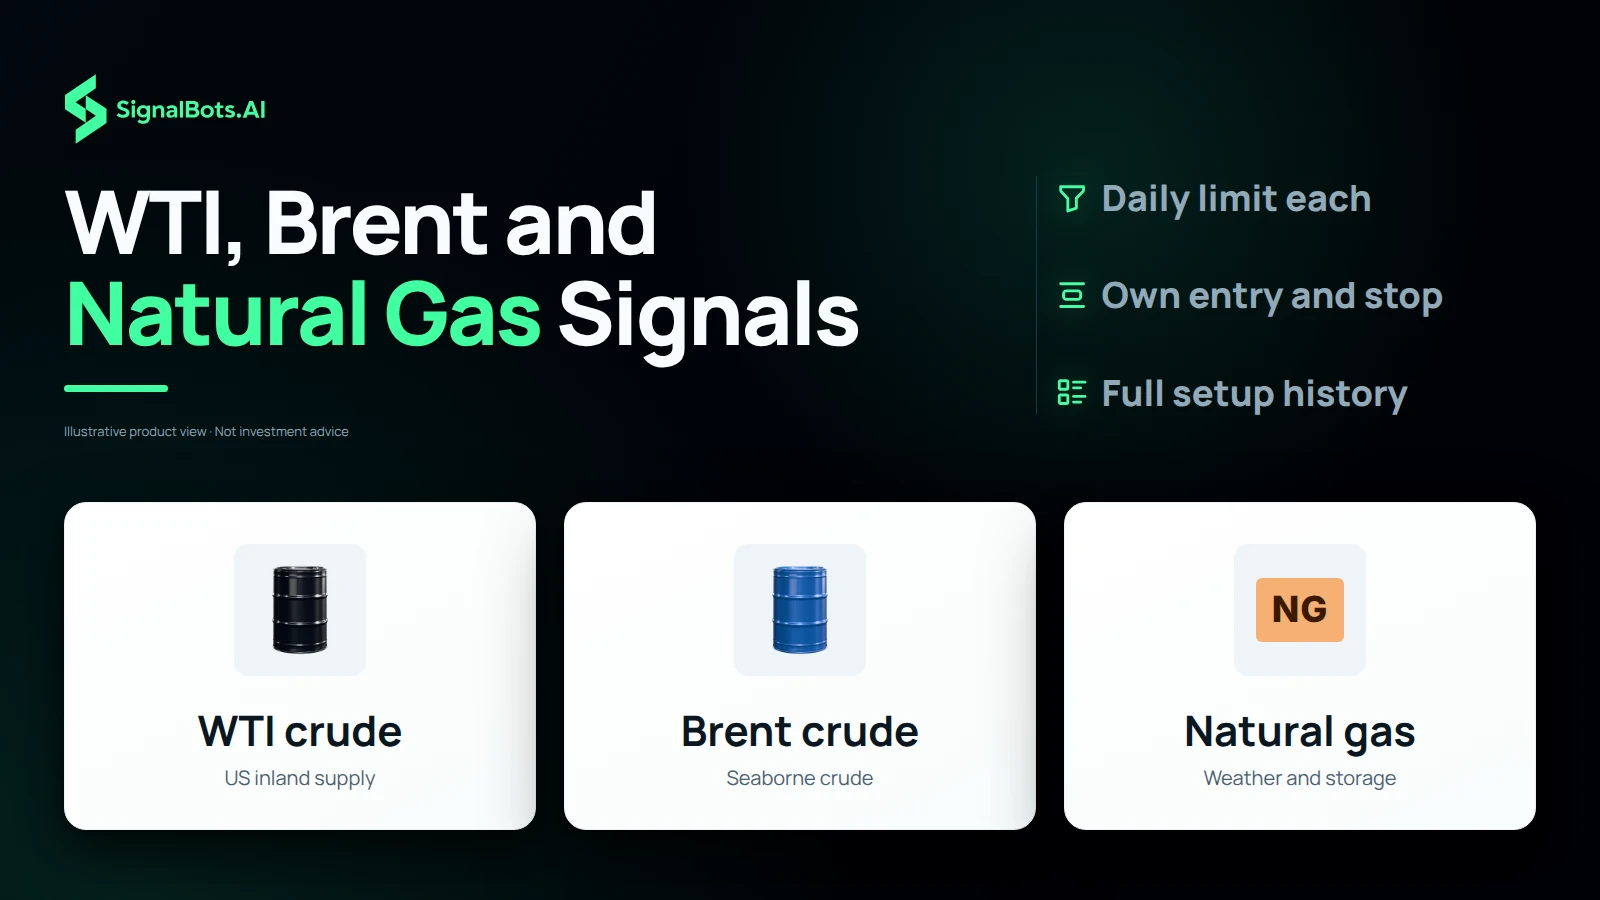
WTI tracks US inland supply, Brent prices seaborne crude, and natural gas answers to weather and storage, so the three rarely move in step. Each benchmark is read on its own candles with its own entry, stop-loss and targets, and a daily limit per instrument keeps one strongly trending market from crowding the other two out of the feed. You follow the whole energy complex from one page, with every setup opening onto its full history.

Three energy markets in one SignalBots feed: WTI crude (black oil barrel, US inland supply), Brent crude (blue oil barrel, seaborne crude) and natural gas (NG, weather and storage), each with a daily limit, its own entry and stop, and a full setup history.
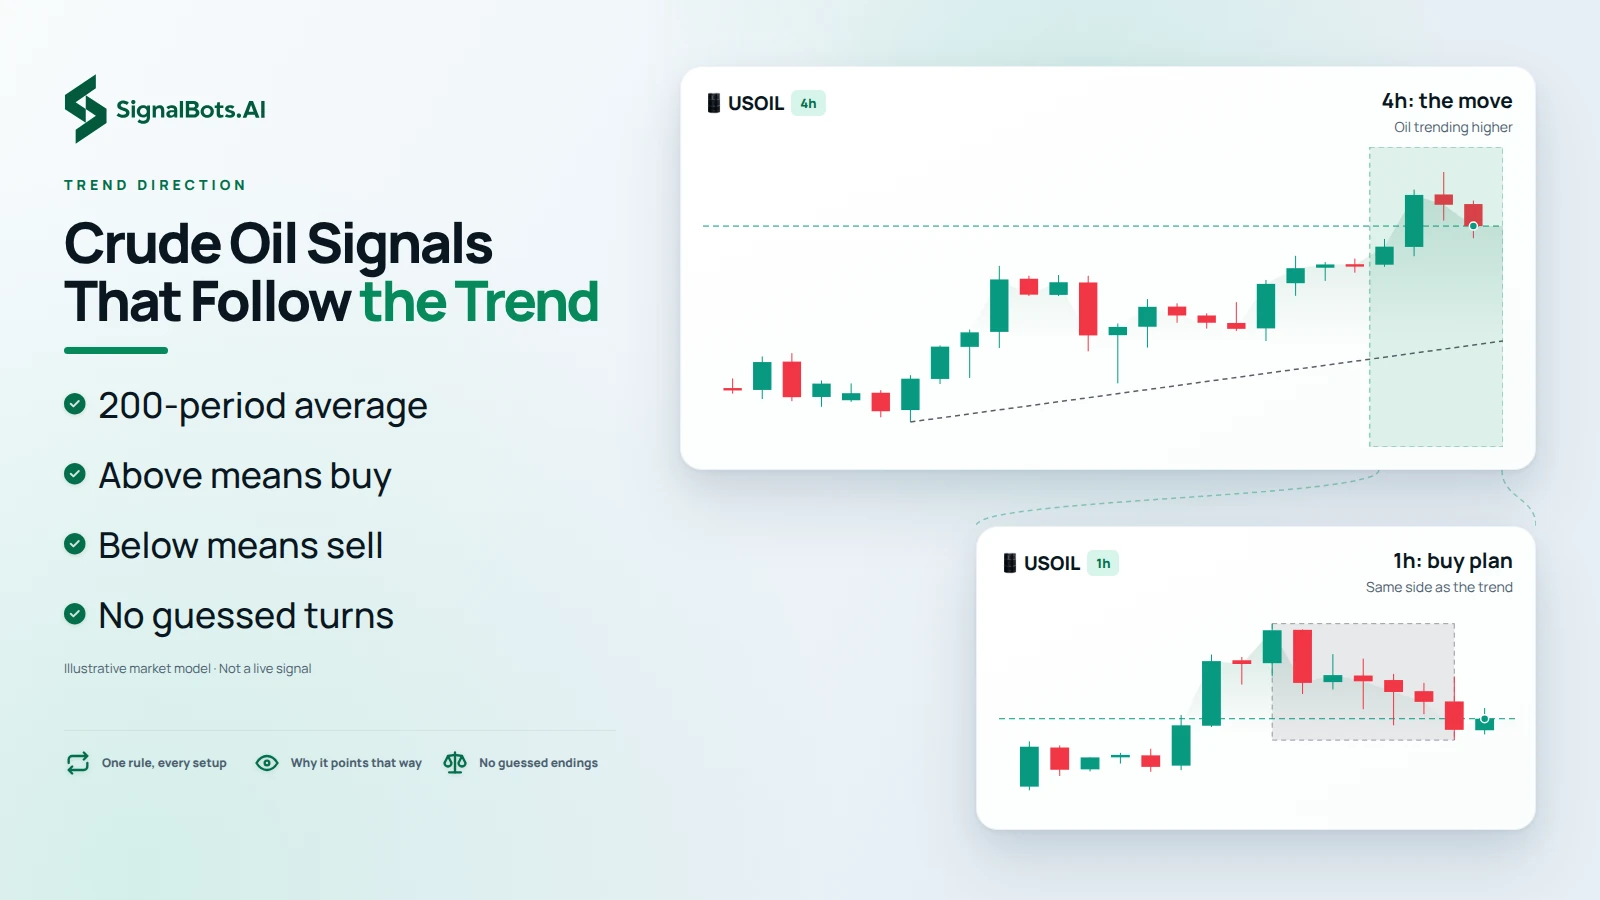
Light image of two USOIL candlestick panes joined by a zoom bracket: a 4h chart labelled '4h: the move, Oil trending higher' rising left to right, and beneath it the bracketed stretch at 1h labelled '1h: buy plan, Same side as the trend', beside bullets naming the 200-period average rule, above means buy and below means sell.

Trend direction

Crude Oil Trading Signals That Follow the Trend

Oil can trend for weeks on production decisions and inventory shifts, and calling the exact turn is hard to do consistently. The direction of every USOIL and UKOIL setup comes from one visible rule: price above its 200-period average means a buy plan, and price below it means a sell plan. You always know why a signal points the way it does, and no signal is built on guessing where a move will end.

Take-profit plan

Oil Trade Plans with Four Take-Profit Targets

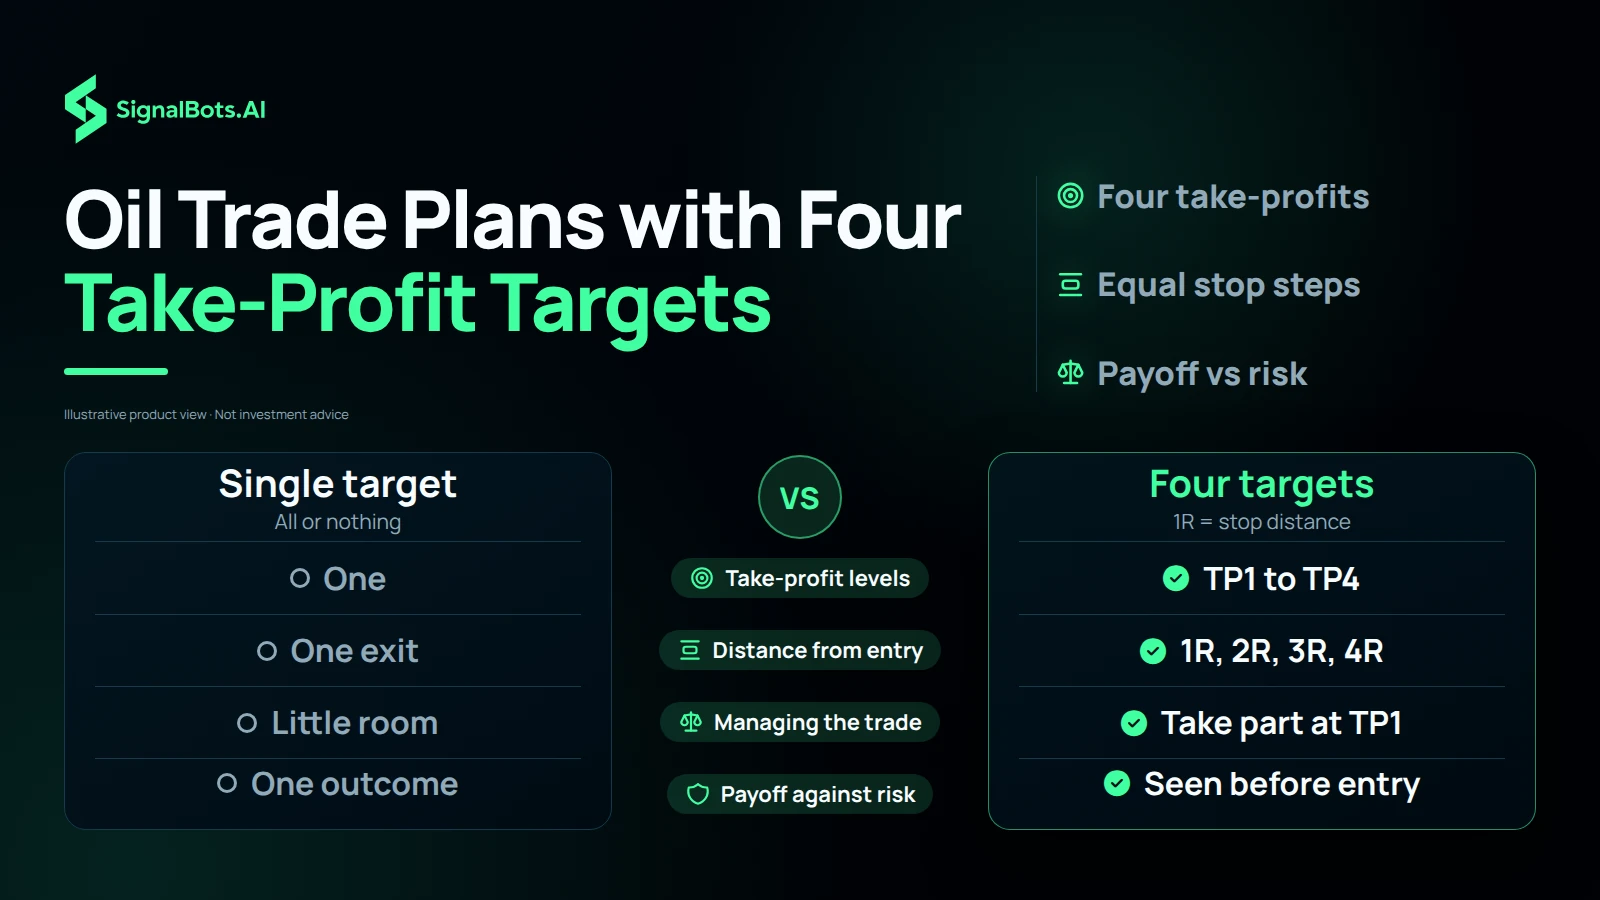
Crude can reverse sharply after an inventory report, so a single all-or-nothing target leaves little room to manage a trade. Every oil signal carries four take-profit levels spaced in equal steps of its stop distance: TP1 sits as far from entry as the stop-loss, and TP4 sits four times as far. You can take part of the position early, leave the rest to work toward the later targets, and see before you enter what each target pays against the risk you are taking.

Dark comparison table setting a single all-or-nothing take-profit beside four take-profit targets, with rows showing TP1 to TP4 at 1R, 2R, 3R and 4R where 1R equals the stop distance, part of the position taken at TP1, and each payoff seen against the risk before entry.
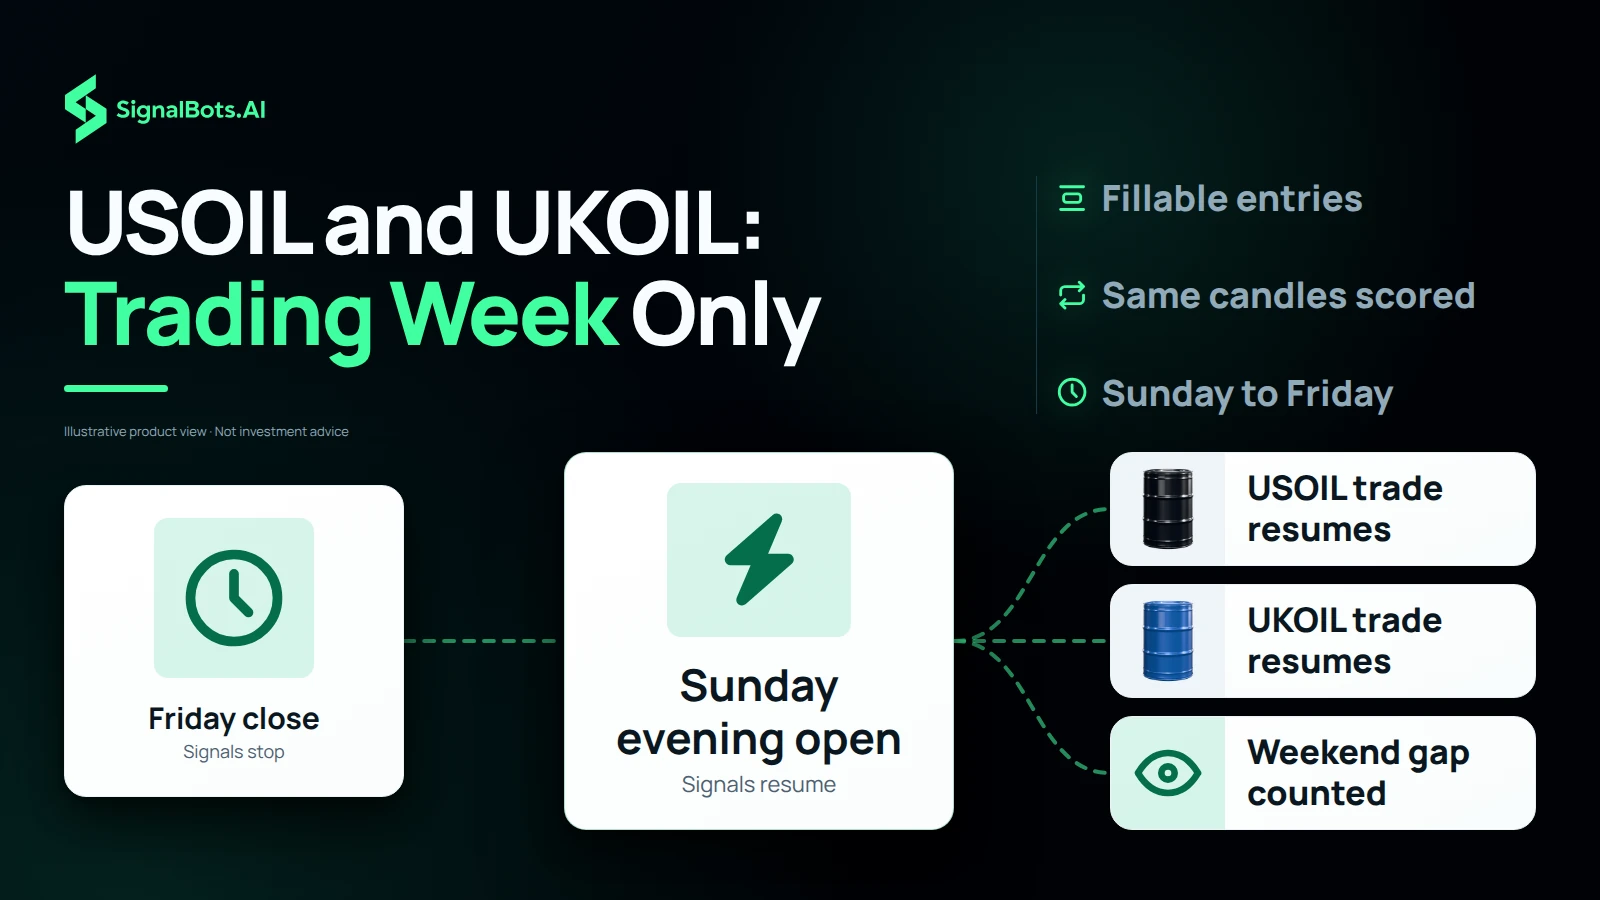
Flow from the Friday close, when oil signals stop, to the Sunday evening open, when they resume, where open USOIL and UKOIL trades pick up again and the weekend gap is counted, with fillable entries and the same candles scored.

Trading hours

USOIL and UKOIL Signals Issued Only During the Trading Week

Crude oil stops trading over the weekend, and the first price of the new week can open well away from Friday's close. New WTI and Brent signals are issued only between the Sunday evening open and the Friday close, so you are never handed an entry priced on a weekend quote nobody can fill. A trade still running at the close is picked up again when trading resumes and scored on the same candles, so weekend gaps count in the results instead of disappearing from them.

Results method

How Crude Oil Signal Results Are Scored

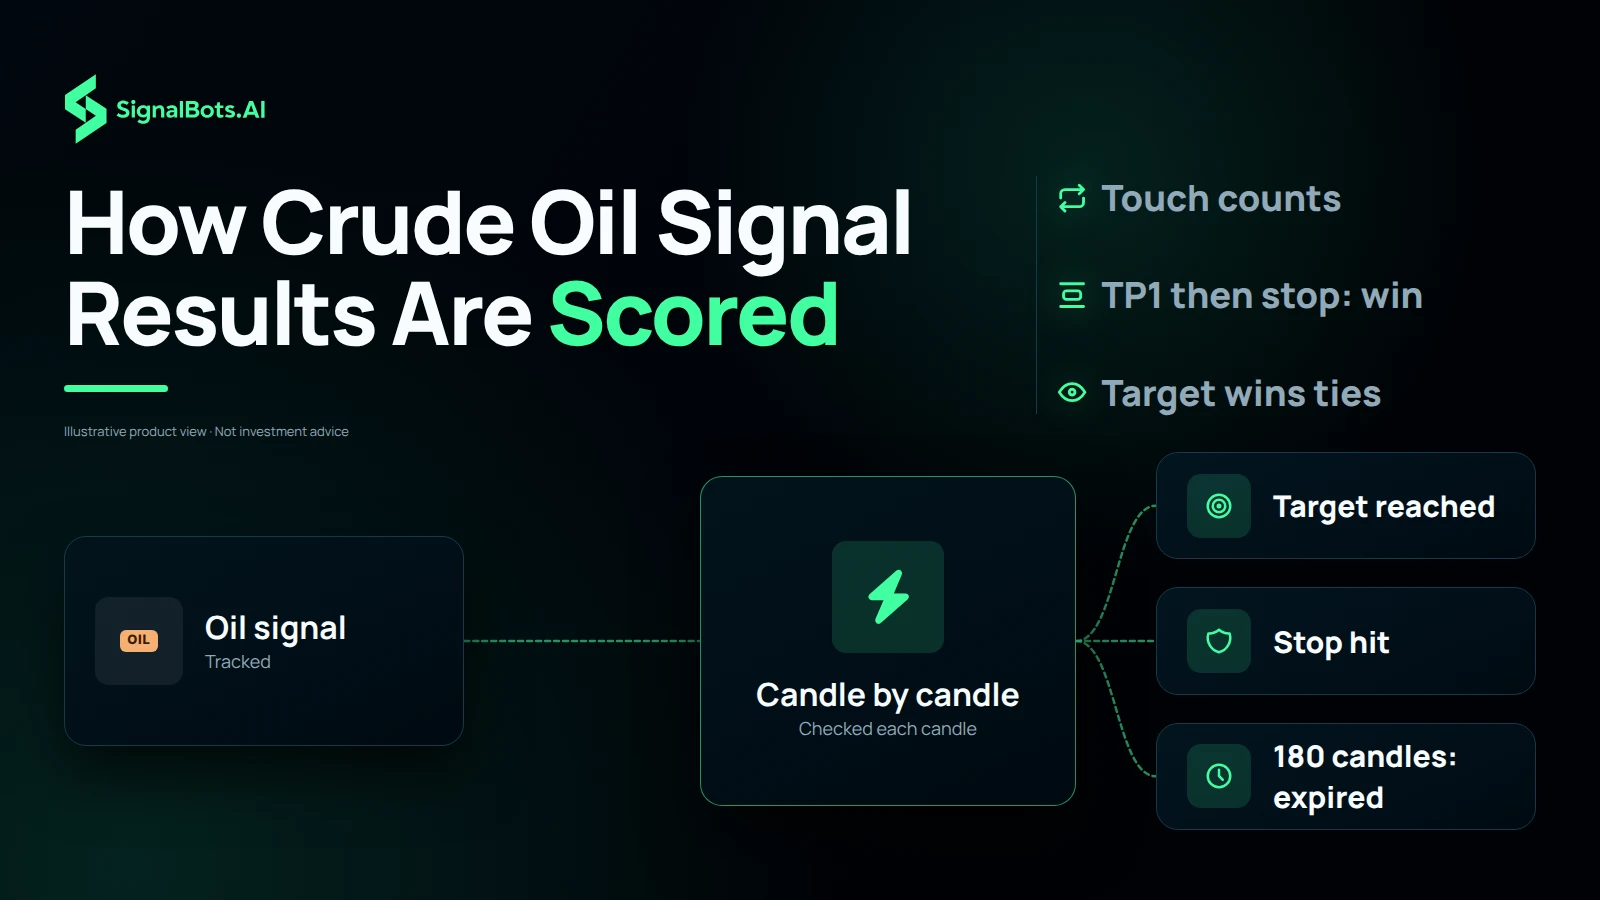
Every oil signal is followed forward candle by candle until it reaches a target, hits its stop or runs out of time. A take-profit counts the moment price touches it; if the stop is hit after TP1, the trade stays recorded as a win at TP1, because that is where the plan said to take profit, and a single candle that touches both a target and the stop is counted at the target. A setup that reaches nothing within 180 candles is closed and labelled expired, counting as neither a win nor a loss.

Dark flow diagram of one oil signal, marked with the OIL chip, followed candle by candle into three recorded endings, 'Target reached', 'Stop hit' and '180 candles: expired', with trust notes that a touch counts, a stop after TP1 is still a win and the target wins a tie.

Win Rate

Wins vs losses
61%
Win Rate

Gain Chart

Cumulative growth over the last 120 days
Past performance is not indicative of future results. WTI Brent trading carries substantial risk — review our Risk Warning before subscribing.
ROI Calculator

What if you traded with us?

Move the slider — see the cumulative return our tracked signals produced over the last 7 days, applied to your starting capital.

Starting $1,000
After last 7 days $1,760 +$760
Hypothetical, based on historical Win Rate. Not a guarantee of future returns.
+4011.8%
Total Gain
2.96%
Max Drawdown
+$389304.0
Net Profit
Full Advanced Statistics Click to expand

Advanced Statistics

Updated Sep 20, 2026 · 20:46 GMT
Balance $399304.0
Equity (100.00%) $399304.0
Floating PL $0.0
Deposits $10000.0
Withdrawals $0
Trades 1435
Pips 3893040
Won 76%
Avg. Trade Time
Lots 186.55
Profit Factor 33.78
Daily 25.78%
Monthly 773.45%
Trades Per Month 285
Expectancy 46215.0 Pips / $4621.5
Trusted by traders

What WTI Brent Traders Are Saying

A WTI Brent trade plan I can check before acting

On the WTI Brent signals page, the WTI Brent entry, stop and targets give me a defined checklist instead of a rushed decision.

Chiamaka Adeyemi
Chiamaka Adeyemi Nigeria

WTI Brent history makes the process easier to review

I use the WTI Brent Recent Results and WTI Brent monthly table to study the setup before I decide whether it fits my own risk plan.

Leonardo Russo
Leonardo Russo Italy

WTI Brent levels help me avoid chasing

Seeing the WTI Brent WTI Brent stop alongside the target keeps me patient when price is already moving quickly.

Anna Gruber
Anna Gruber Austria

WTI Brent context without hiding the risk

The WTI Brent WTI Brent page makes the outcome history visible, so I can keep position size and risk limits under my own control.

William Hansen
William Hansen Denmark

One focused view for WTI Brent

The WTI Brent WTI Brent alerts and symbol filters make it much easier to follow the instruments I actually trade.

Mia Schmidt
Mia Schmidt Germany

Ready to trade WTI / Brent crude with us?

Full access to every signal across 3 instruments, with instant alerts on the web, Telegram, our extension and mobile app.

No card needed