SUI/USD Trading Signals
Real-time SUI/USD signals with a full trade plan — entry, stop-loss, and take-profit targets, delivered in under 10ms on the web, Telegram, our browser extension and mobile app.
Recent Results
Per-symbol net percentage outcome by day across the last 30 trading sessions. Filter to a symbol to isolate its track.
Swipe the chart sideways to read every session.
Monthly Summary Click to toggle
| Month, Year | Total (Net %) | SUI/USD |
|---|---|---|
| Month-to-date | 205.0 | 205.0 |
| August 2026 | 88.0 | 88.0 |
| July 2026 | 41.0 | 41.0 |
| June 2026 | 21.0 | 21.0 |
| May 2026 | 125.0 | 125.0 |
Disclaimer: Past performance does not guarantee future results, and the results shown here represent historical outcomes only and may not be repeated. Please trade and invest with caution; the information provided is for informational purposes only and does not constitute investment or trading advice.
Last 20 Signals
| Date, time | Order | Price | Take Profit | Stop Loss | State | Entry | Exit | Profit |
|---|---|---|---|---|---|---|---|---|
| September 13, 2026 at 12:00 PM GMT Sep 13, 26 12:00 GMT | Sell | 0.711000 | 0.710244, 0.709489, 0.708733, 0.707978 | 0.711756 | TP1 Hit | 0.711000 | 0.710244 | +8 |
| September 11, 2026 at 1:00 PM GMT Sep 11, 26 13:00 GMT | Sell | 0.739900 | 0.731804, 0.723708, 0.715613, 0.707517 | 0.747996 | TP1 Hit | 0.739900 | 0.731804 | +81 |
| September 11, 2026 at 4:00 AM GMT Sep 11, 26 04:00 GMT | Sell | 0.736500 | 0.727333, 0.718166, 0.708999, 0.699833 | 0.745667 | TP3 Hit | 0.736500 | 0.708999 | +275 |
| September 10, 2026 at 8:00 AM GMT Sep 10, 26 08:00 GMT | Sell | 0.764100 | 0.763376, 0.762652, 0.761928, 0.761204 | 0.764824 | TP1 Hit | 0.764100 | 0.763376 | +7 |
| September 10, 2026 at 3:00 AM GMT Sep 10, 26 03:00 GMT | Sell | 0.770200 | 0.760065, 0.749930, 0.739794, 0.729659 | 0.780335 | TP4 Hit | 0.770200 | 0.729659 | +405 |
| September 9, 2026 at 6:30 PM GMT Sep 9, 26 18:30 GMT | Sell | 0.800000 | 0.781602, 0.763204, 0.744806, 0.726409 | 0.818398 | TP4 Hit | 0.800000 | 0.726409 | +736 |
| September 9, 2026 at 10:00 AM GMT Sep 9, 26 10:00 GMT | Buy | 0.807600 | 0.819979, 0.832358, 0.844738, 0.857117 | 0.795221 | TP1 Hit | 0.807600 | 0.819979 | +124 |
| September 9, 2026 at 8:00 AM GMT Sep 9, 26 08:00 GMT | Buy | 0.823000 | 0.825236, 0.827473, 0.829709, 0.831945 | 0.820764 | TP2 Hit | 0.823000 | 0.827473 | +45 |
| September 9, 2026 at 3:00 AM GMT Sep 9, 26 03:00 GMT | Buy | 0.811200 | 0.819552, 0.827904, 0.836256, 0.844607 | 0.802848 | TP2 Hit | 0.811200 | 0.827904 | +167 |
| September 9, 2026 at 2:00 AM GMT Sep 9, 26 02:00 GMT | Buy | 0.816200 | 0.828821, 0.841442, 0.854063, 0.866685 | 0.803579 | TP1 Hit | 0.816200 | 0.828821 | +126 |
| September 8, 2026 at 7:00 PM GMT Sep 8, 26 19:00 GMT | Buy | 0.810400 | 0.820803, 0.831206, 0.841610, 0.852013 | 0.799997 | TP1 Hit | 0.810400 | 0.820803 | +104 |
| September 8, 2026 at 4:40 AM GMT Sep 8, 26 04:40 GMT | Sell | 0.819100 | 0.817930, 0.816760, 0.815590, 0.814420 | 0.820270 | TP4 Hit | 0.819100 | 0.814420 | +47 |
| September 8, 2026 at 3:00 AM GMT Sep 8, 26 03:00 GMT | Buy | 0.817300 | 0.831679, 0.846059, 0.860438, 0.874818 | 0.802921 | TP1 Hit | 0.817300 | 0.831679 | +144 |
| September 8, 2026 at 12:00 AM GMT Sep 8, 26 00:00 GMT | Buy | 0.818500 | 0.832994, 0.847487, 0.861981, 0.876474 | 0.804006 | TP1 Hit | 0.818500 | 0.832994 | +145 |
| September 7, 2026 at 10:00 AM GMT Sep 7, 26 10:00 GMT | Buy | 0.805700 | 0.826618, 0.847536, 0.868454, 0.889371 | 0.784782 | TP1 Hit | 0.805700 | 0.826618 | +209 |
| September 7, 2026 at 8:00 AM GMT Sep 7, 26 08:00 GMT | Buy | 0.796400 | 0.808985, 0.821571, 0.834156, 0.846741 | 0.783815 | TP3 Hit | 0.796400 | 0.834156 | +378 |
| September 7, 2026 at 1:30 AM GMT Sep 7, 26 01:30 GMT | Buy | 0.800100 | 0.808851, 0.817602, 0.826352, 0.835103 | 0.791349 | TP1 Hit | 0.800100 | 0.808851 | +88 |
| September 6, 2026 at 7:55 PM GMT Sep 6, 26 19:55 GMT | Buy | 0.795900 | 0.797299, 0.798698, 0.800097, 0.801496 | 0.794501 | TP4 Hit | 0.795900 | 0.801496 | +56 |
| September 6, 2026 at 8:00 AM GMT Sep 6, 26 08:00 GMT | Sell | 0.794400 | 0.791826, 0.789252, 0.786678, 0.784104 | 0.796974 | TP1 Hit | 0.794400 | 0.791826 | +26 |
| September 6, 2026 at 8:00 AM GMT Sep 6, 26 08:00 GMT | Buy | 0.794400 | 0.808376, 0.822352, 0.836327, 0.850303 | 0.780424 | TP3 Hit | 0.794400 | 0.836327 | +419 |
Common questions about SUI/USD signals
How fast do signals reach me?
Every signal pushes to you in under 10 milliseconds from when our engine fires — it lands on the web dashboard, Telegram, our browser extension, and the mobile app at the same time, so you never miss an entry.
What crypto markets do you cover?
Every crypto instrument with a live track record shows up as a card on this page, busiest first. Tap any card to open its full signal history.
What's inside each signal?
A clear direction (Buy or Sell), an entry price, a protective stop loss, and take-profit targets — plus a live status that updates as the trade plays out.
How should I size each trade?
We suggest risking 1–2% of your account per trade. Your position size then follows from the stop distance on each signal and the risk percentage you're comfortable with.
Where can I see past results?
Right on this page — the Recent Results chart and the full statistics panel above show every tracked outcome. We publish the complete record, wins and losses alike.
How will I receive signals?
Through whichever channels suit you — the web dashboard, Telegram, our browser extension, and the mobile app all stay in sync, so each signal reaches you wherever you are.
How do I get VIP access?
VIP access comes with every plan — message our team and we'll set you up.
Do you guarantee profits?
No — and be wary of anyone who does. Crypto trading carries substantial risk. Read our Risk Warning and judge the historical edge for yourself before subscribing.
Can I cancel any time?
Yes. Cancel in one click from your dashboard — no hidden fees and no auto-renewal traps.
Still have questions?
Our team is happy to help before you join — get in touch and we'll walk you through anything you're unsure about.
Example trade plan
SUI/USD Trading Signals with Entry, Stop Loss and First Target
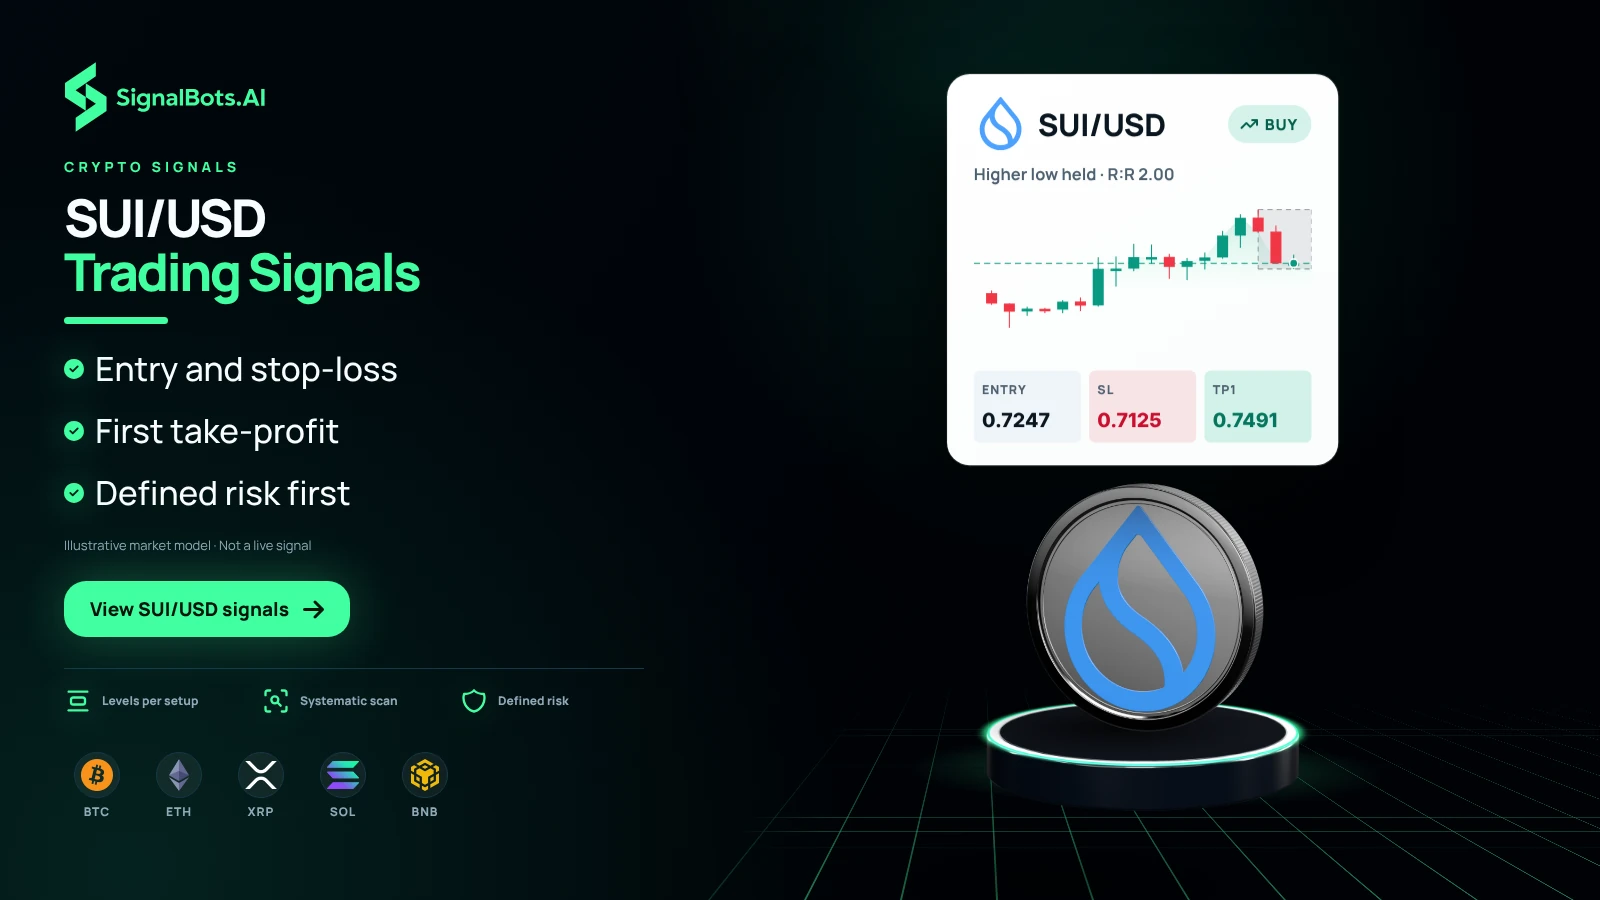
The card shows one illustrative SUI/USD buy signal: the direction at the top, the candlestick chart that produced it, then the entry, the stop-loss and the first take-profit, the nearest of four targets. Because the stop is printed before the trade opens, you know what you are risking before you commit a single token. The same kind of plan is published for the other coins shown beneath it: Bitcoin, Ethereum, XRP, Solana and BNB.
Intraday candle sizes
SUI Signals on Intraday Charts
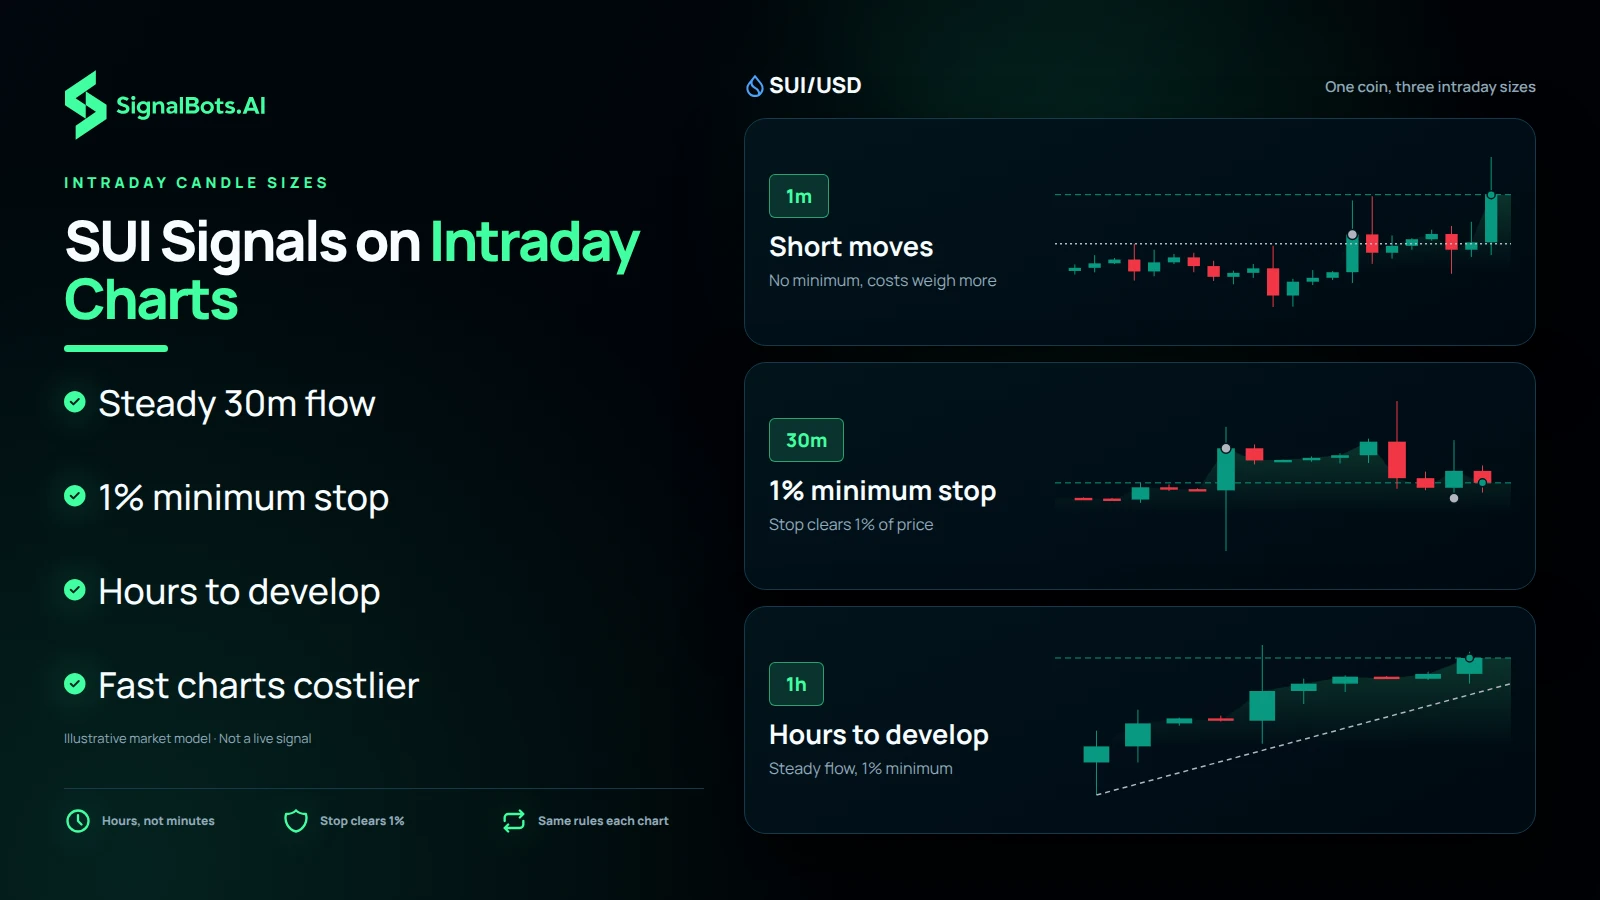
Sui has produced setups right across the intraday charts, including a steady flow on 30m and 1h candles, where each stop must clear 1% of price. Those slower intraday signals give a trade hours to develop instead of minutes. For shorter moves, 1m and 5m setups are published without that minimum, and their results are more exposed to trading costs.
Stop-based sizing
Position Sizing for SUI Signals
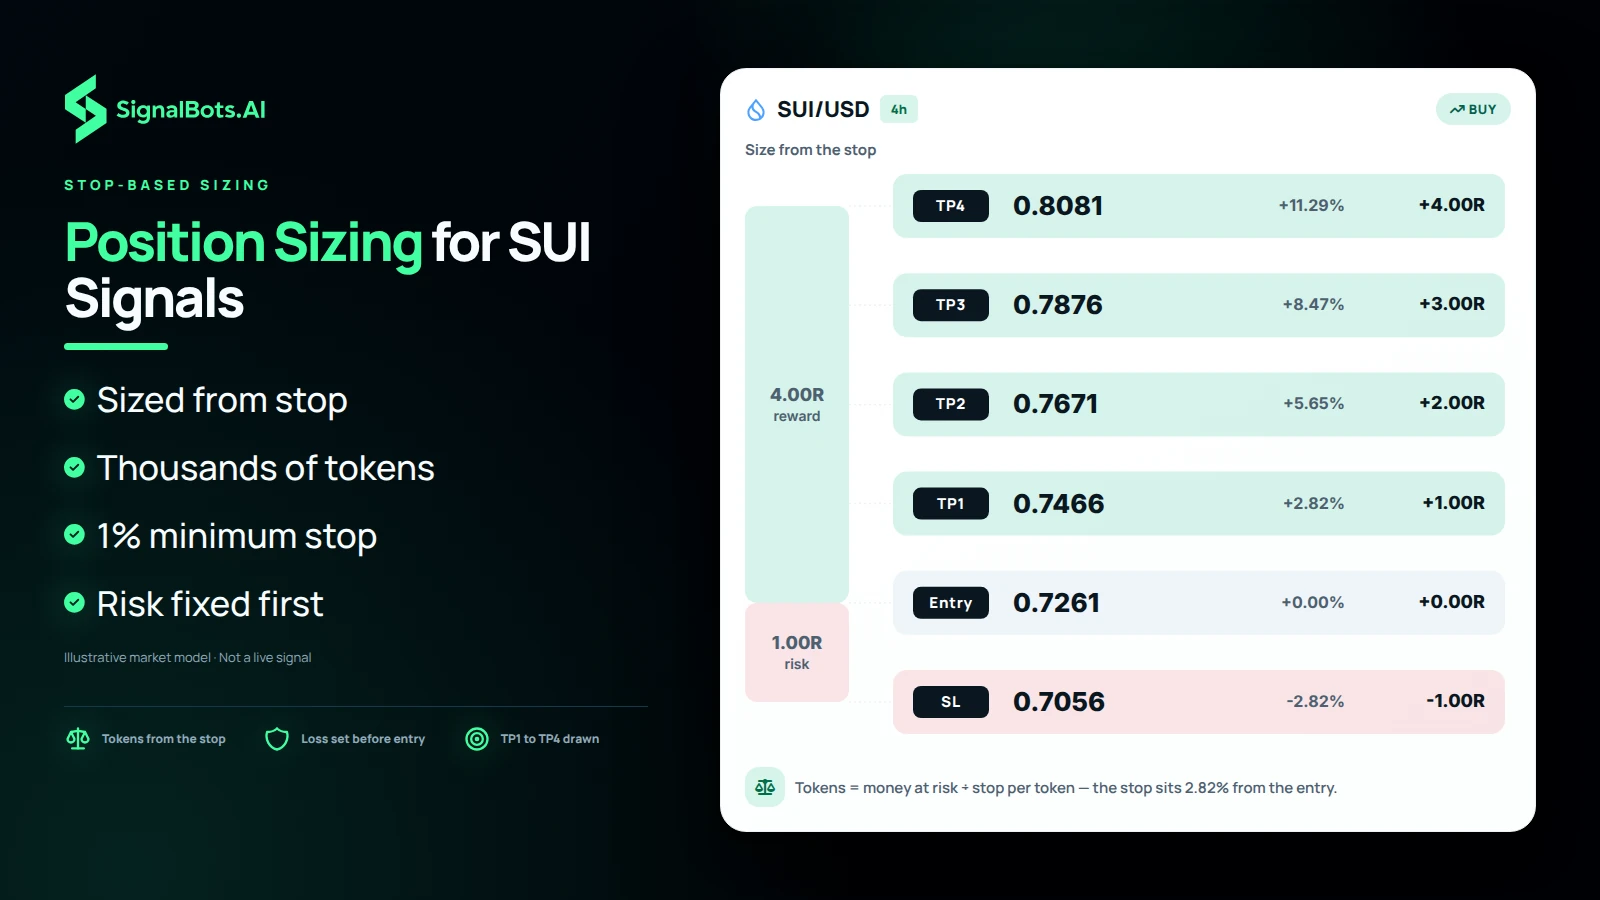
SUI trades at under a dollar, so a sensible position can mean thousands of tokens, and it is easy to lose track of the money at risk. Size each signal from its stop: the amount you are willing to lose divided by the stop distance per token gives the number of tokens to hold. Because every stop on 30m and slower charts is at least 1% of price, the position stays reasonable even when the coin looks cheap.
Trend-side directions
SUI/USD Signals in Buy and Sell Directions
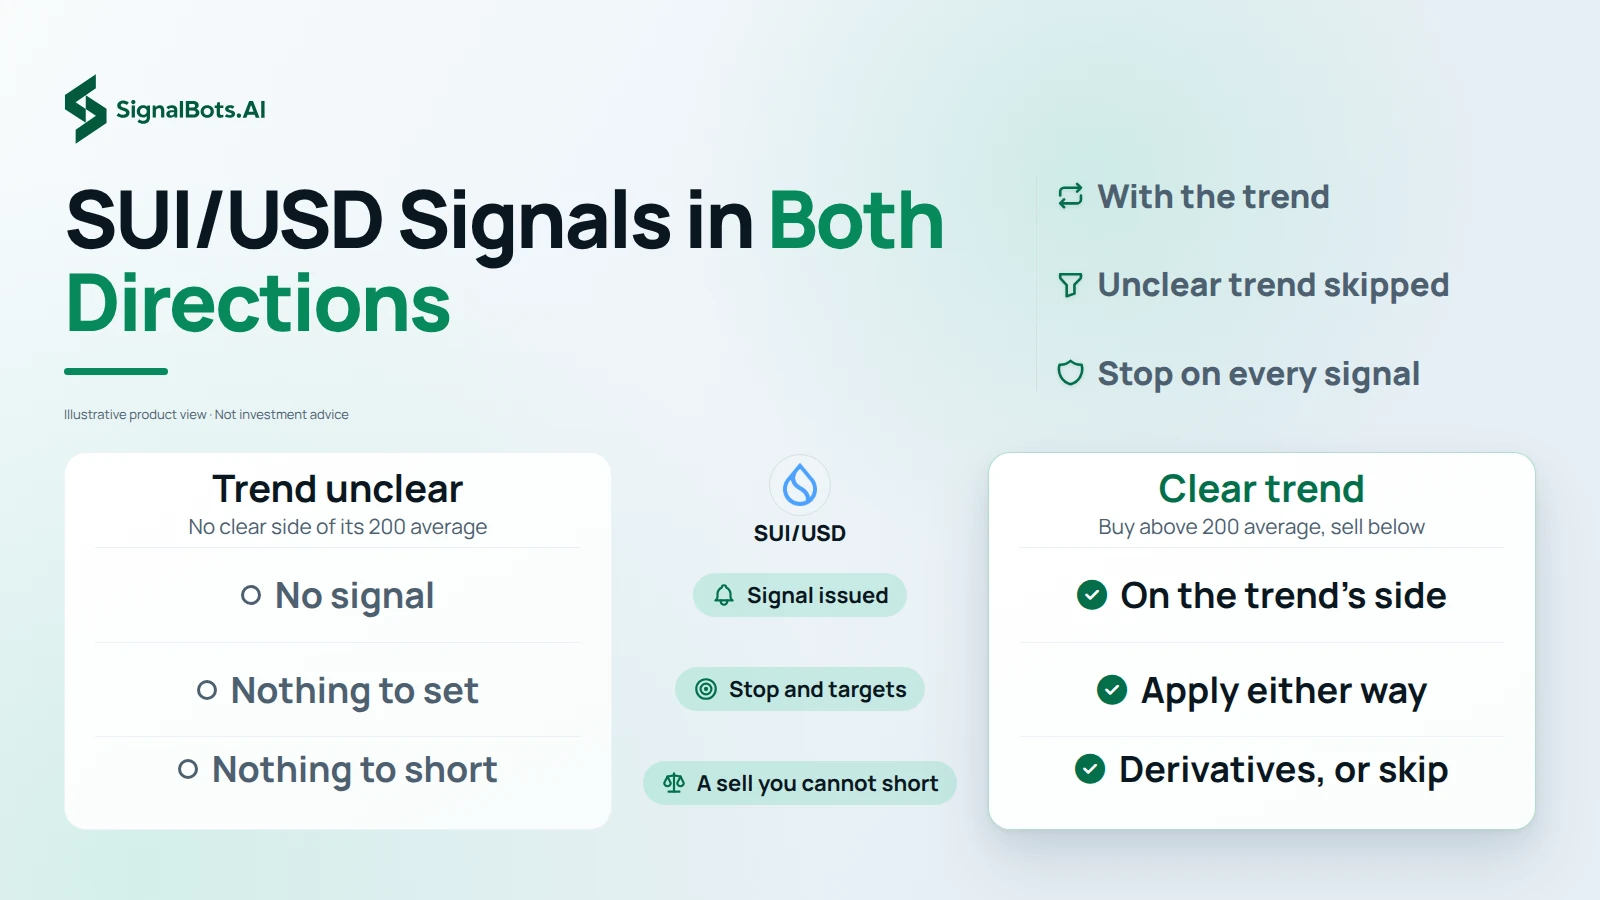
Each SUI/USD setup is a buy only when price is above its 200-period average and a sell only when it is below, which keeps every signal on the side of Sui's prevailing trend. If you cannot short the token where you trade, a sell signal is best taken on a derivatives account or skipped; its stop and targets apply either way. When the trend is unclear, no signal is issued.
Complete signal record
SUI Signal History with Every Outcome Kept
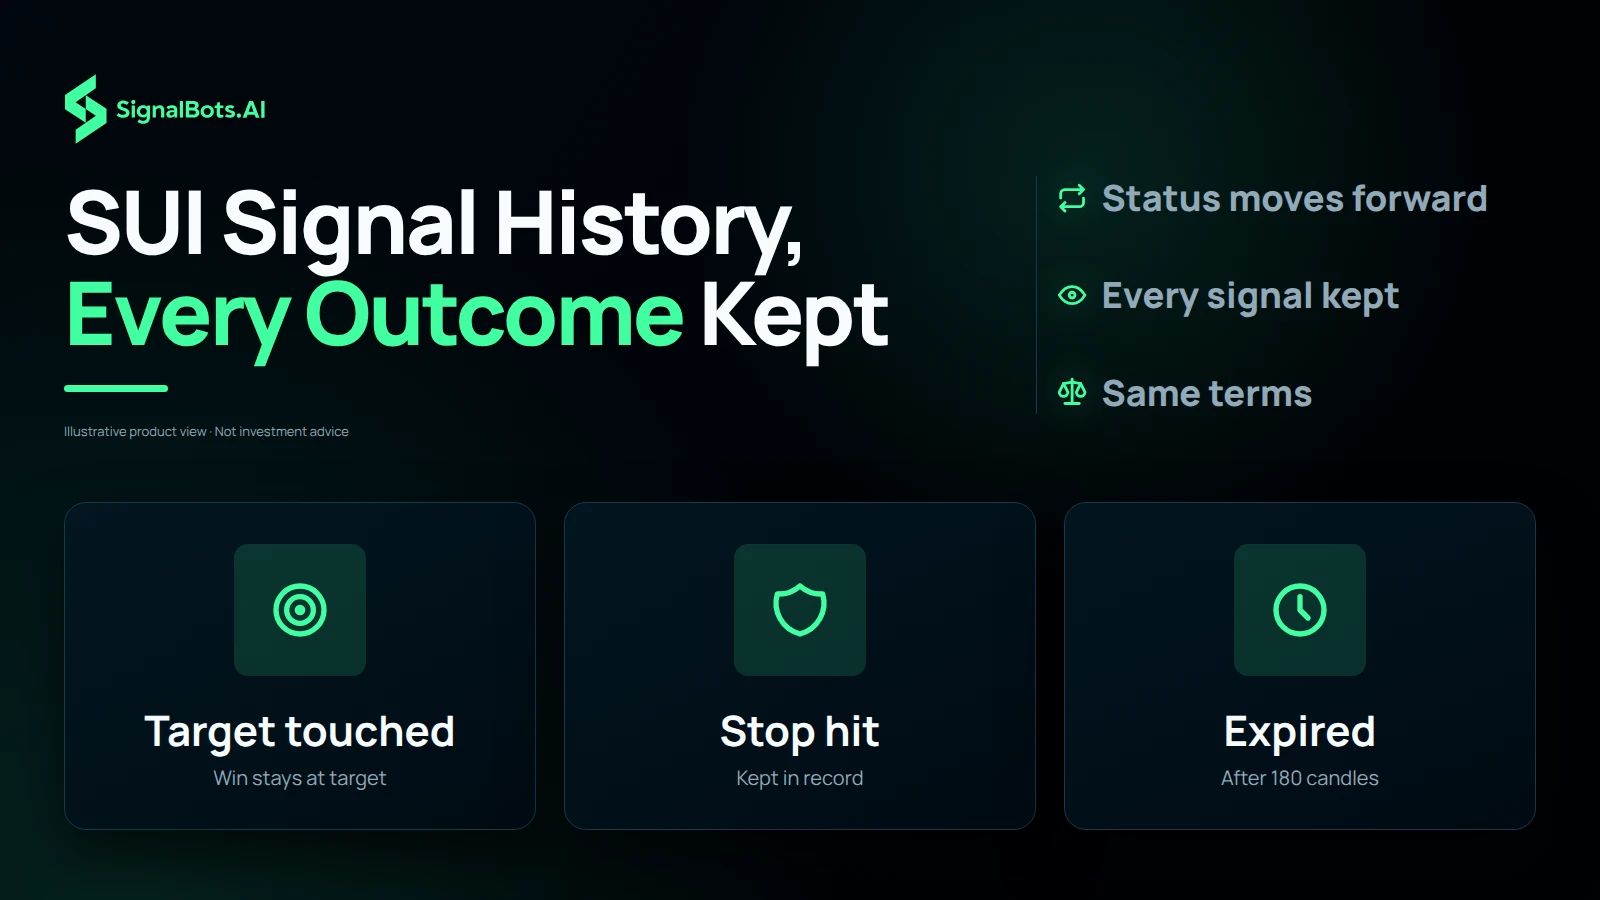
The SUI/USD history on this page keeps every published signal with its final status, whether a target was reached, the stop was hit or the trade expired after 180 candles. Statuses only move forward: once a take-profit is touched, a later stop leaves the win at that level in place. That consistency is what lets you compare SUI's record with the other coins on the same terms.
Win Rate
Wins vs lossesGain Chart
Cumulative growth over the last 120 daysWhat if you traded with us?
Move the slider — see the cumulative return our tracked signals produced over the last 7 days, applied to your starting capital.
Full Advanced Statistics Click to expand
Advanced Statistics
Updated Sep 14, 2026 · 11:48 GMTKeep your exchange. Keep your edge.
No switching accounts, no relearning a platform. Whichever crypto exchange you already trade with, these signals plug straight in — read them here, or let our extensions, robots and connectors act on them for you.
What SUI/USD Traders Are Saying
Ready to trade SUI/USD with us?
Full access to every signal, with instant alerts on the web, Telegram, our extension and mobile app.
Unlock VIP Crypto Signals
Message our 24/7 support team on Telegram or Viber. They'll walk you through VIP access to our crypto signals — a monthly plan or one of our free partner routes — and switch on your live entry, stop-loss and take-profit alerts the moment you're ready.
- Message our support team Telegram · @SignalBotsai
- Message support on Viber +971 58 887 5100
- Get set up with our bot Guided steps, then straight to support
Replies usually arrive within minutes during business hours.