Free Global Indices Trading Signals

Live signals on the DAX, FTSE, Nikkei and more — each index setup with a clear entry, stop-loss and take-profit, refreshed as markets move. Tap any index for its full history.

Live Signals
LIVE 4 instruments Last signal 9 active now
Performance

Recent Results

Per-symbol net percentage outcome by day across the last 30 trading sessions. Filter to a symbol to isolate its track.

Monthly Summary Click to toggle
Month, Year Total (Net %) Nikkei 225 (Japan) DAX 40 (Germany) EURO50 UK
Month-to-date 880.0 182.0 309.0 219.0 170.0
August 2026 819.0 320.0 240.0 118.0 141.0
July 2026 686.0 131.0 174.0 240.0 141.0
June 2026 683.0 214.0 127.0 157.0 185.0
May 2026 437.0 112.0 139.0 124.0 62.0

Disclaimer: Past performance does not guarantee future results, and the results shown here represent historical outcomes only and may not be repeated. Please trade and invest with caution; the information provided is for informational purposes only and does not constitute investment or trading advice.

NIKKEI 5 Minutes
Buy
Entry 65171.25
Stop Loss 65062.86
TP1 65279.64
TP2 65388.03
TP3 65496.42
TP4 65604.81
TP1 Hit #122749
DAX 5 Minutes
Buy
Entry 25573.38
Stop Loss 25560.22
TP1 25586.54
TP2 25599.69
TP3 25612.85
TP4 25626.01
VIP Clients Only
Active #123209
EURO50 1 Minute
Buy
Entry 6320.03
Stop Loss 6317.94
TP1 6322.12
TP2 6324.22
TP3 6326.31
TP4 6328.41
Loss #123208
FTS/GBP 1 Minute
Buy
Entry 10752.71
Stop Loss 10751.36
TP1 10754.06
TP2 10755.40
TP3 10756.75
TP4 10758.10
Loss #123206
Get every signal instantly Web, Telegram, browser extension, and mobile app — all included on any plan.
FAQs

Frequently Asked Questions

How fast do signals reach me?

Every signal pushes to you in under 10 milliseconds from when our engine fires — it lands on the web dashboard, Telegram, our browser extension, and the mobile app at the same time, so you never miss an entry.

What global indices markets do you cover?

Every global indices instrument with a live track record shows up as a card on this page, busiest first. Tap any card to open its full signal history.

What's inside each signal?

A clear direction (Buy or Sell), an entry price, a protective stop loss, and take-profit targets — plus a live status that updates as the trade plays out.

How should I size each trade?

We suggest risking 1–2% of your account per trade. Your position size then follows from the stop distance on each signal and the risk percentage you're comfortable with.

Where can I see past results?

Right on this page — the Recent Results chart and the full statistics panel above show every tracked outcome. We publish the complete record, wins and losses alike.

How will I receive signals?

Through whichever channels suit you — the web dashboard, Telegram, our browser extension, and the mobile app all stay in sync, so each signal reaches you wherever you are.

How do I get VIP access?

VIP access comes with every plan — message our team and we'll set you up.

Do you guarantee profits?

No — and be wary of anyone who does. Global Indices trading carries substantial risk. Read our Risk Warning and judge the historical edge for yourself before subscribing.

Can I cancel any time?

Yes. Cancel in one click from your dashboard — no hidden fees and no auto-renewal traps.

Still have questions?

Our team is happy to help before you join — get in touch and we'll walk you through anything you're unsure about.

Global coverage

DAX, FTSE 100, Nikkei 225 and Euro Stoxx 50 Signals

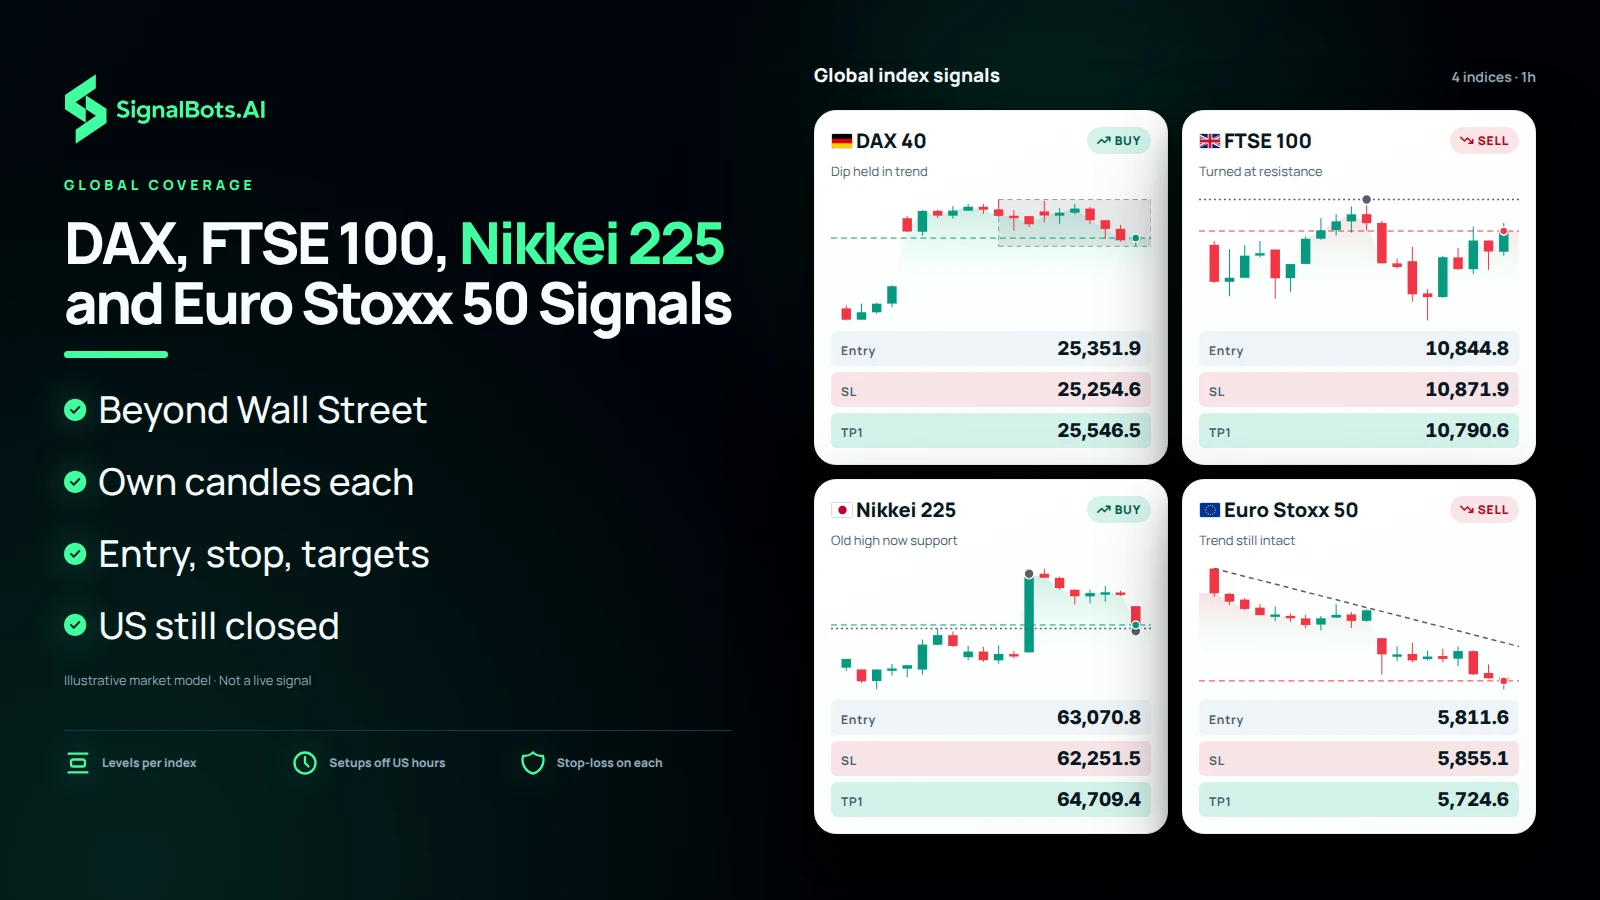
Global index signals cover Germany's DAX, the UK's FTSE 100, Japan's Nikkei 225 and the Euro Stoxx 50, which tracks 50 of the eurozone's largest companies. These markets answer to different central banks, currencies and earnings calendars, so each index is read on its own candles with its own entry, stop-loss and targets. That gives you trade ideas beyond Wall Street, including Tokyo and European setups that appear while US markets are still closed.

Illustrative board of four 1h index signal cards, each with its own flag, candle strip and its own Entry, SL and TP1 prices: DAX 40 (German flag) buy, FTSE 100 (UK flag) sell, Nikkei 225 (Japanese flag) buy and Euro Stoxx 50 (EU flag) sell.
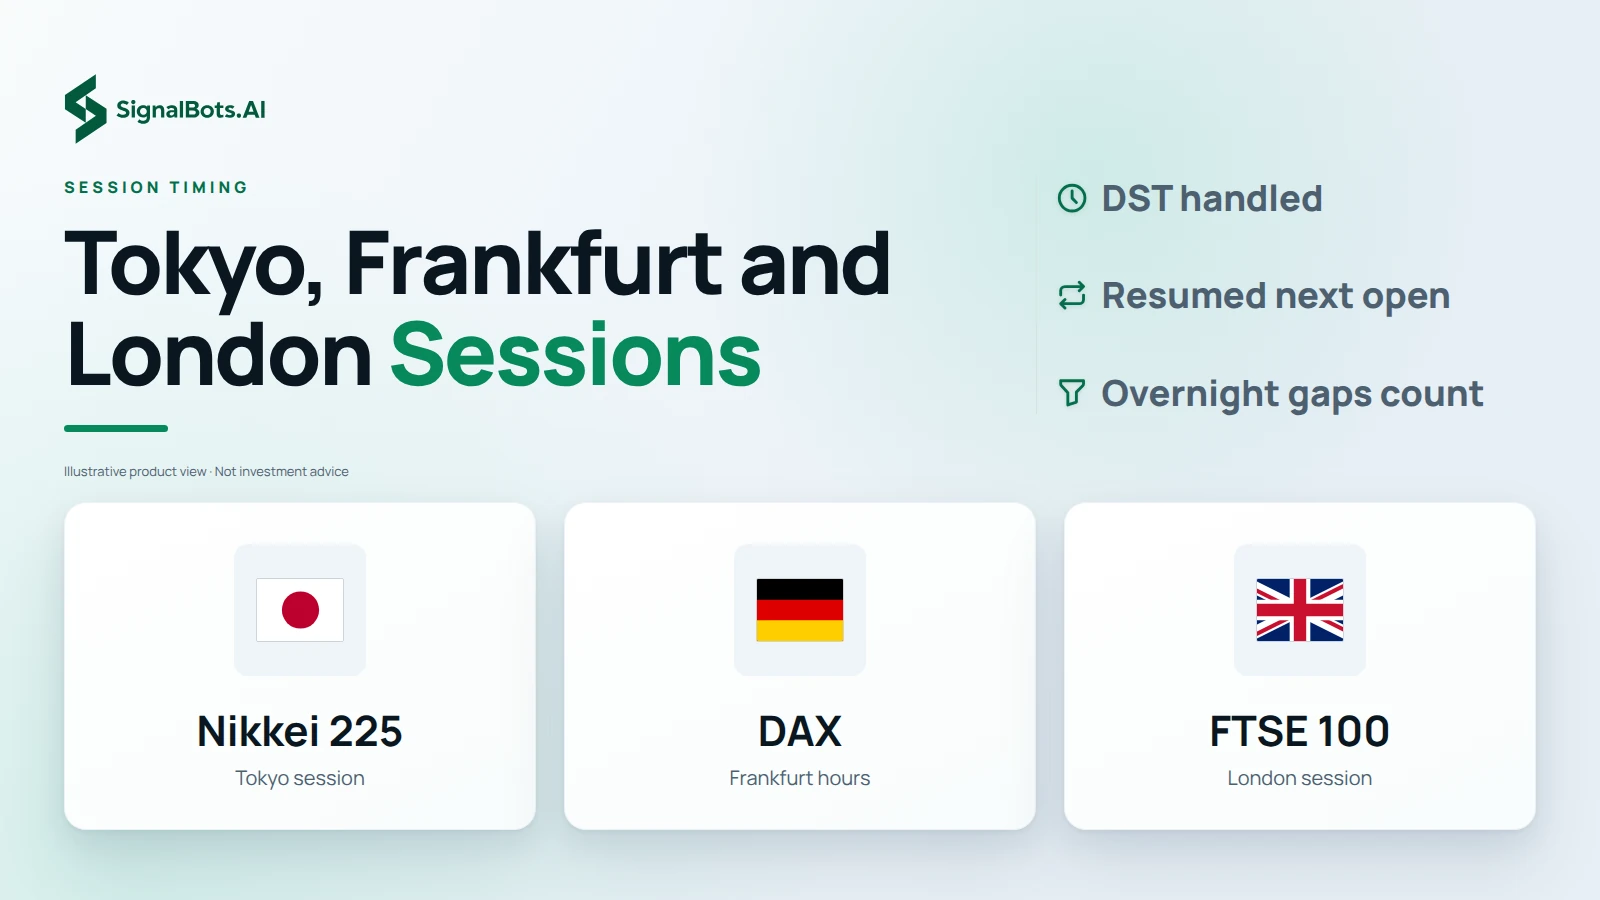
Illustrative grid of three tiles pairing each index's flag with its exchange session (Nikkei 225 in the Tokyo session, DAX in Frankfurt hours, FTSE 100 in the London session), beside notes that daylight saving is handled, trades resume at the next open and overnight gaps count.

Session timing

Index Signals Timed to the Tokyo, Frankfurt and London Sessions

A cash index only moves during its own exchange's hours, and a price quoted after the close is not one you can trade. New Nikkei 225 signals are issued during the Tokyo session, DAX and Euro Stoxx 50 signals during Frankfurt hours, and FTSE 100 signals during the London session, with daylight saving handled automatically. A trade still running when its session ends is picked up again at the next open and scored on the same candles, so overnight gaps count in the record.

Swing trading

Swing Trading Signals for European and Asian Indices

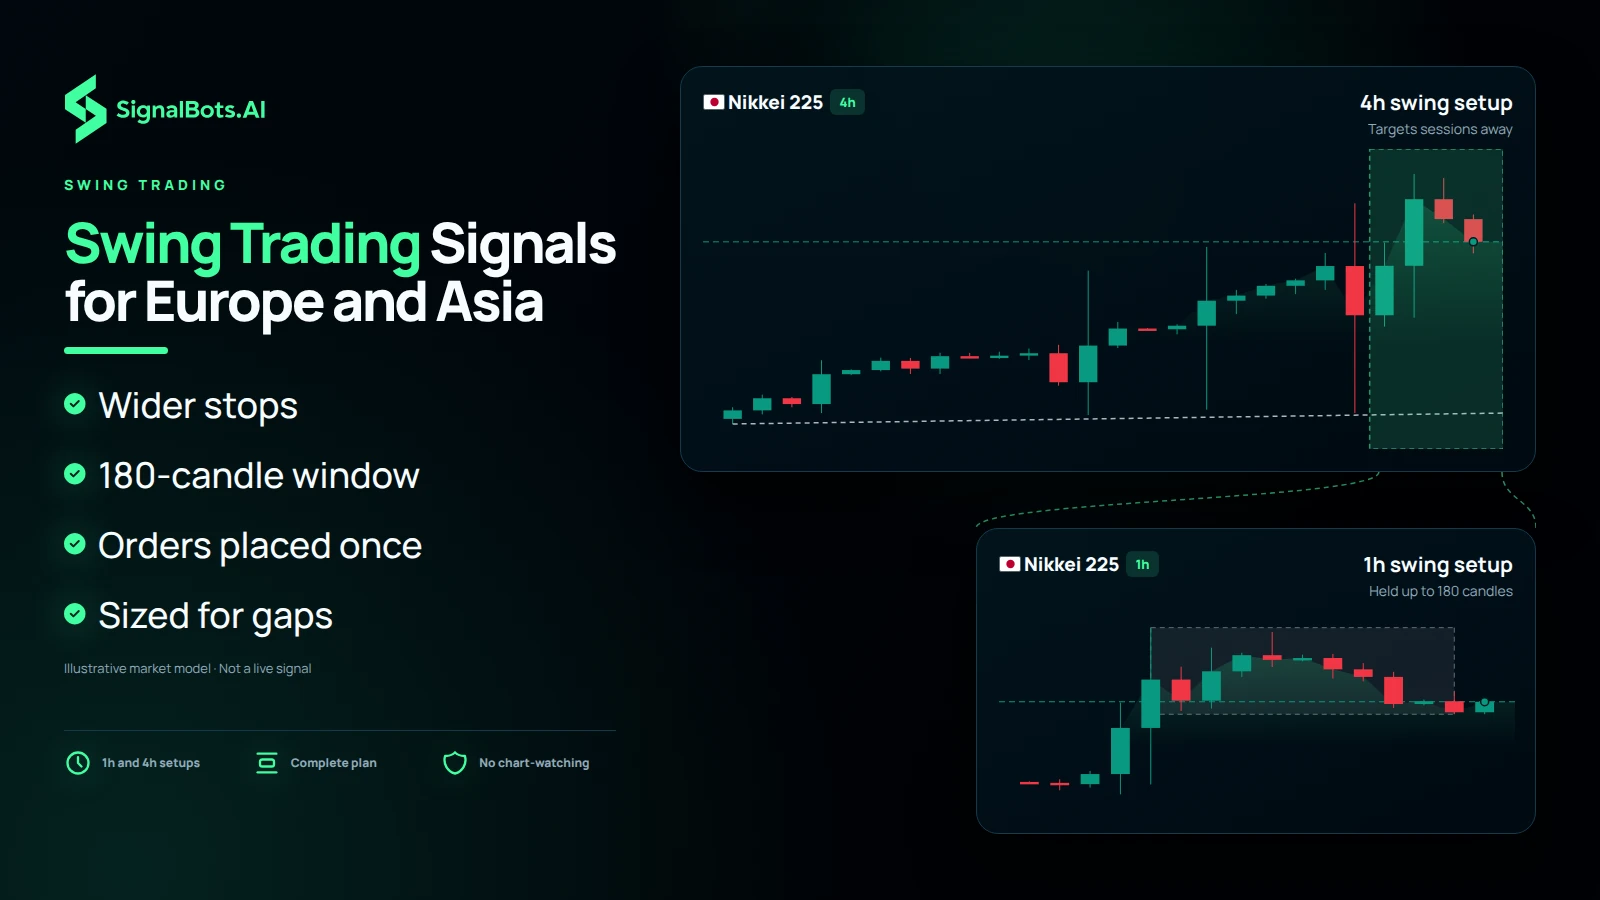
Following Frankfurt or Tokyo from another time zone rarely leaves room to watch every candle. The 1h and 4h setups on these indices are built for that: wider stops, targets that can take several sessions to reach, and a holding window of up to 180 candles before an untouched trade is closed as expired. Each signal carries the complete plan, so you can place your orders once, sized for the gaps a closed session can bring, instead of watching the chart through the night.

Illustrative two-pane Nikkei 225 chart (Japanese flag) of one long trade: a 4h swing setup labelled 'Targets sessions away', with a bracket over the stretch magnified below as a 1h swing setup labelled 'Held up to 180 candles', no prices shown.
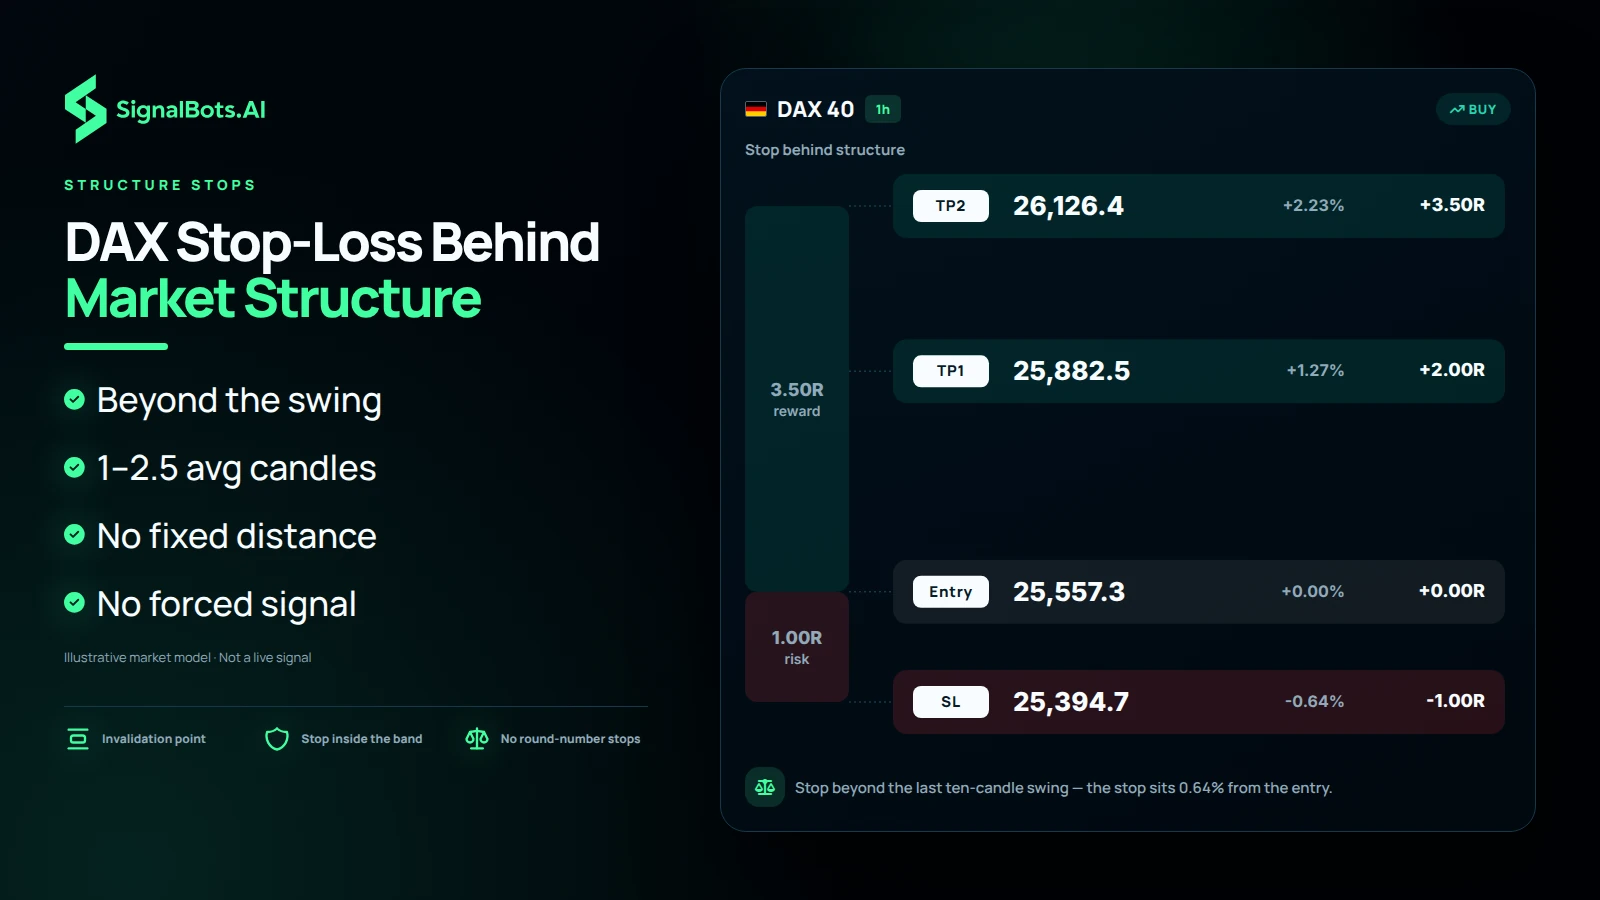
Illustrative DAX 40 1h buy plan drawn to scale, with Entry 25,557.3, stop-loss 25,394.7 (-0.64%, 1R), TP1 25,882.5 (+2.00R) and TP2 26,126.4 (+3.50R), and a footer noting the stop sits beyond the last ten-candle swing.

Structure stops

DAX Signals with Stop-Loss Levels Behind Market Structure

A stop parked at a round number or a fixed distance is easy for a fast index like the DAX to tag by accident. Here the stop-loss sits beyond the most recent ten-candle swing against the trade, the point where the setup's idea no longer holds, and it is kept between one and two and a half average candles from entry. If the trend side offers no sensible place for a stop, the index simply gets no signal rather than a forced one.

Signal flow

A Steady Flow of Global Index Signals, Not a Flood

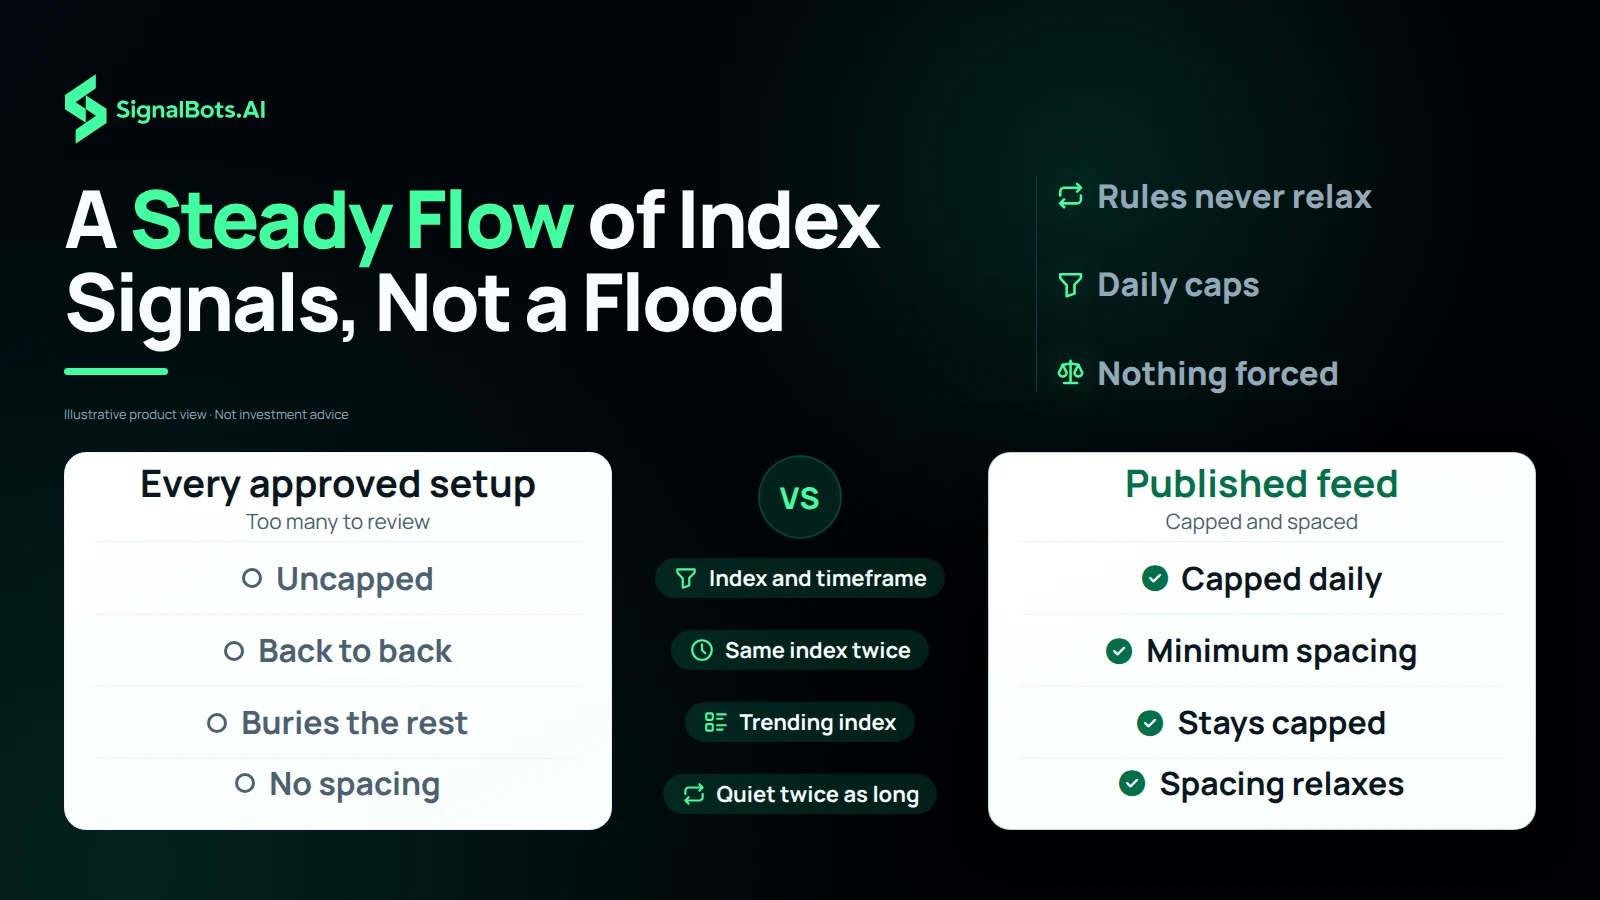
Checked on every candle across four indices and five timeframes, the rules would approve far more setups than anyone can review. Signals are capped per index and per timeframe each day, with a minimum spacing between two signals on the same index, so a trending DAX cannot bury the Nikkei and FTSE 100 in your feed. When a quiet market has gone twice as long as usual without a setup, the spacing relaxes, but the rules themselves never do, so a market with no valid setup still publishes nothing.

Illustrative comparison of every approved setup against the published feed, row by row: uncapped versus capped daily per index and timeframe, back to back versus minimum spacing on the same index, a trending index burying the rest versus staying capped, and no spacing versus spacing that relaxes after a quiet spell twice as long.

Win Rate

Wins vs losses
71%
Win Rate

Gain Chart

Cumulative growth over the last 120 days
Past performance is not indicative of future results. Global Indices trading carries substantial risk — review our Risk Warning before subscribing.
ROI Calculator

What if you traded with us?

Move the slider — see the cumulative return our tracked signals produced over the last 7 days, applied to your starting capital.

Starting $1,000
After last 7 days $1,760 +$760
Hypothetical, based on historical Win Rate. Not a guarantee of future returns.
+4076.53%
Total Gain
9.58%
Max Drawdown
+$368579.8
Net Profit
Full Advanced Statistics Click to expand

Advanced Statistics

Updated Sep 21, 2026 · 11:08 GMT
Balance $378579.8
Equity (100.00%) $378579.8
Floating PL $0.0
Deposits $10000.0
Withdrawals $0
Trades 1473
Pips 368579800
Won 82%
Avg. Trade Time
Lots 191.49
Profit Factor 10.43
Daily 6.69%
Monthly 200.68%
Trades Per Month 80
Expectancy 3259446.6 Pips / $3259.45
Built for your broker

Keep your broker. Keep your edge.

No switching accounts, no relearning a platform. Whichever forex broker you already trade with, these signals plug straight in — read them here, or let our extensions, robots and connectors act on them for you.

Trusted by traders

What Global Indices Traders Are Saying

A Global Indices trade plan I can check before acting

On the Global Indices signals page, the Global Indices entry, stop and targets give me a defined checklist instead of a rushed decision.

Lukas Schmidt
Lukas Schmidt Germany

Global Indices history makes the process easier to review

I use the Global Indices Recent Results and Global Indices monthly table to study the setup before I decide whether it fits my own risk plan.

Maria Santos
Maria Santos Portugal

Global Indices levels help me avoid chasing

Seeing the Global Indices Global Indices stop alongside the target keeps me patient when price is already moving quickly.

James Johnson
James Johnson United States

Global Indices context without hiding the risk

The Global Indices Global Indices page makes the outcome history visible, so I can keep position size and risk limits under my own control.

Emma Martin
Emma Martin France

One focused view for Global Indices

The Global Indices Global Indices alerts and symbol filters make it much easier to follow the instruments I actually trade.

Yiannis Georgiou
Yiannis Georgiou Greece

Ready to trade global indices with us?

Full access to every signal across 4 instruments, with instant alerts on the web, Telegram, our extension and mobile app.

No card needed