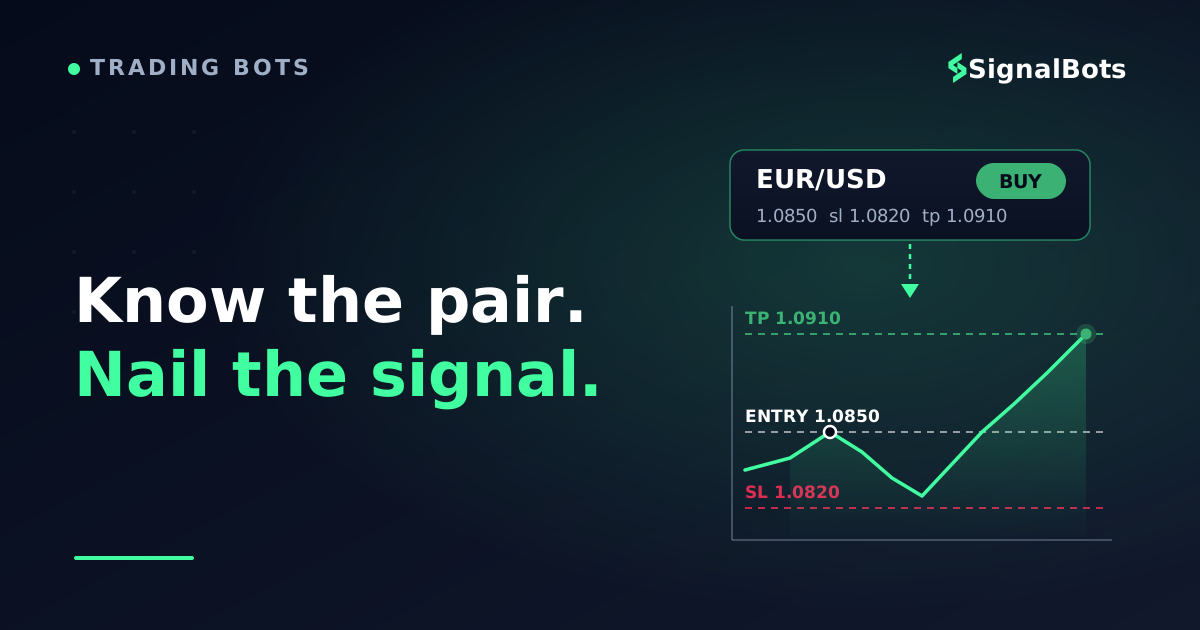
The alert lands: EUR/USD — BUY — entry 1.0850, stop 1.0820, target 1.0910. Four numbers and a direction. If you have ever hesitated at that exact moment — not because you doubted the signal, but because you were not sure what the pair would do with it — this guide closes that gap.
Here is the part most pair guides and most signal guides both skip: a trading signal is generated for one specific pair, and every field in it assumes that pair's behavior. A 30-pip stop is sensible on EUR/USD in the London session; the same stop on GBP/JPY can be eaten by ordinary noise inside an hour. Trading currency pairs with signals well is less about the signal and more about knowing the instrument it fires on.
So that is what you will build here: a working read on how majors and crosses are quoted, what gives each pair its personality, when they actually move, and how to go long or short on each one with correct size — whether you click the trade yourself or hand execution to a bot. Run this checklist before taking a signal on any pair; the rest of the article expands each line.
The method in 8 ticks
Pair-readiness checklist — run it before you take the signal
0 / 8
Name the base and quote currency, and what a BUY makes you long and short
Know the pair's pip size and pip value in your account currency
Confirm the pair is inside its liquid session hours right now
Check the calendar for both central banks behind the pair
Convert the signal's stop distance into a dollar risk at your size
Cap that risk at a fixed percentage of your balance
Scan your open trades for correlated pairs before adding this one
Decide before the alert arrives: manual click, or automated execution
★
Checklist complete — you’re cleared to proceed.
Eight ticks between an alert and a well-executed trade. Every item is expanded in a section below.
Key Takeaways
A signal's BUY or SELL only has meaning on the pair it was generated for - its stop distance, target and hold time all assume that pair's personality.
Pip value, spread and volatility differ by pair: fix your dollar risk per trade and let the pair's stop distance set the lot size, never the reverse.
Liquidity follows the session clock - the London-New York overlap is prime time for the majors, and a session filter (human or bot) keeps you out of the thin hours.
Correlated pairs stack exposure: simultaneous buys on EUR/USD and GBP/USD are usually one short-dollar bet wearing two symbols, so split the risk between them.
Table of Contents (37 min read)Contents
What a Buy or Sell Signal Actually Does to a Pair
Every currency pair is two trades in one. In EUR/USD, the euro is the base currency and the US dollar is the quote currency — the price is simply how many dollars one euro buys. So when the signal direction reads BUY, you are going long the euro and short the dollar in the same instant. SELL flips it: short euros, long dollars.
That sounds like trivia until you see what it means for the signal itself: every buy or sell on a pair is a relative-strength call, not an "up or down" bet on one currency. If the euro and the dollar both strengthen against everything else at the same pace, EUR/USD barely moves and your signal goes nowhere. Good forex signals are really statements about the gap between two economies — which is why the same signal-generation engine can fire different calls on EUR/USD and USD/JPY in the same minute.
Three quoting mechanics sit between the signal's numbers and your actual fill:
Bid and ask. Every pair quotes two prices. Your long opens at the ask and closes at the bid; a short does the reverse. The gap between them is the spread — the toll you pay per round trip, charged before the trade has moved a single pip.
Pips. The standard unit of movement — the fourth decimal place on most pairs, but the second decimal on JPY-quoted pairs like USD/JPY and GBP/JPY. A signal's stop distance only makes sense once you know which convention its pair uses.
Pip value. What one pip is worth in your account currency, per lot. On USD-quoted pairs it is fixed per lot size; on JPY-quoted pairs it floats with the exchange rate. This single number is why the same stop distance is a different dollar risk on different pairs.
One practical note on the entry price: a signal quotes one level, but your platform shows two. Expect a long to fill a fraction above the signal's number (the ask) and plan around it — on a liquid major in busy hours the difference is a rounding error; on a thin cross at the wrong hour it is not. Before you ever size a trade, check what a pip is actually worth on your pair with the forex pip value calculator.
Every Pair Has a Personality
Traders talk about pairs the way pilots talk about aircraft: same physics, completely different handling. A signal engine sees this in the data — average range, spread behavior, how cleanly a pair respects levels — and calibrates stops and targets per pair. You should hold the same mental model.
EUR/USD is the benchmark: the deepest and most heavily traded pair in the market, with the tightest spreads and the most orderly price behavior. Its long-term driver is the policy gap between the European Central Bank and the Federal Reserve — when one is cutting rates while the other holds, the pair trends; when both wait, it ranges. That depth and orderliness is exactly why it is the default first pair for executing signals, and why automated strategies are usually validated on it first. You can watch a live AI EUR/USD signal feed to see how entries, stops and targets are calibrated to this pair's rhythm.
GBP/JPY sits at the other end of the temperament scale. It is a cross (no US dollar leg), famous for large intraday ranges and sharp accelerations — it pulls in the pound's headline-sensitivity and the yen's role as a risk-sentiment barometer at the same time. High volatility is not a defect; it is the trade-off: more distance to capture per signal, but wider stops, wider spreads, and less forgiveness for sloppy timing. The live GBP/JPY signal page is a useful contrast — notice how much wider its typical stop distances run than EUR/USD's.
USD/JPY is the rate-differential machine: it tracks the gap between US bond yields and Japan's, and doubles as a risk-appetite gauge. GBP/USD behaves like a faster, moodier EUR/USD. AUD/USD imports commodity and China sensitivity. The point is not to memorize all of them — it is to know that a signal's stop, target and expected hold time inherit the personality of the pair underneath.
Know your instrument
Pair
Personality
Spread & liquidity
Prime hours (UTC)
What moves it
EUR/USD
The benchmark major — deep, orderly, trend-friendly
Tightest in the market
07:00–16:00, best 12:00–16:00
ECB vs Fed policy gap, EU & US data
GBP/USD
Faster major, headline-sensitive
Tight, widens on UK news
07:00–16:00
Bank of England, UK inflation & politics
USD/JPY
Rate-differential machine, risk gauge
Very tight, steady
00:00–09:00 and 12:00–16:00
US yields, Bank of Japan, risk sentiment
GBP/JPY
High-volatility cross, big ranges
Wider, jumps in fast markets
07:00–16:00
BoE + BoJ policy, global risk appetite
AUD/USD
Commodity-linked major
Tight in overlaps, thin late
00:00–09:00, plus London open
RBA policy, China data, commodities
Five personalities, one signal format. The stop distance and hold time a signal carries are calibrated to the row it belongs to.
A practical rule for signal traders: two or three pairs you genuinely understand beat ten you follow blindly. Depth of familiarity is what lets you sanity-check a signal in seconds — does this stop distance fit this pair at this hour? — instead of taking every alert on faith.
The Session Clock Decides When Your Pair Is Awake
Forex trades around the clock five days a week, but it is not the same market around the clock. Liquidity follows the sun through four sessions — Sydney, Tokyo, London, New York — and each pair is only fully awake when at least one of its home markets is open. EUR/USD is at its best from the London open onward and peaks in the London–New York overlap, when both of its economies are at their desks. JPY pairs get an extra pulse in the Tokyo morning.
Liquidity follows the sun
When each FX session is open (UTC)24-hour clock · times in UTC
UTC timeline
SydneyTokyoLondonNew York
21:00–24:0021:0000:00–6:00–6:00
0:00–9:000:00
7:00–16:007:00
12:00–21:0012:00
000306091215182124
Tokyo + London7:00–9:00 UTC · JPY crosses wake up
London + New York12:00–16:00 UTC · Peak liquidity & volatility
Sydney
Tokyo
London
New York
Overlap (peak liquidity)
The London–New York overlap is prime time for the majors: the deepest books, the tightest spreads, and the ranges that let a signal reach its target.
Why should a signal trader care? Because the same pair is effectively two different instruments at 14:00 UTC and at 22:00 UTC. In the dead hours between the New York close and Tokyo's open, books thin out, spreads widen, and a market order travels further before it finds a counterparty. A signal taken there starts with a worse fill and a bigger toll — before the trade idea has been tested at all.
This is one of the first places automation quietly earns its keep. A trading session filter on a bot enforces the clock for you: signals that arrive outside your pair's liquid window are skipped automatically, with no 3 a.m. discipline required. If you trade manually, the same rule applies — you just have to be the filter.
Going Long, Going Short — Executing on Your Pair
Mechanically, forex is refreshingly symmetric. Going long means buying the pair: you profit if the base currency strengthens against the quote. Going short means selling it first — and unlike shorting a stock, there is nothing to borrow or arrange, because every pair trade is simultaneously a buy of one currency and a sale of the other. A SELL signal on EUR/USD is executed with one click, exactly like a BUY, and behaves as a long position on the dollar side of the pair.
What makes a signal executable is that it arrives pre-framed: a direction, an entry, a stop-loss placed beyond the level that would prove the idea wrong, and a take-profit that pays for the risk taken. Here is what that framing looks like on an actual chart — a pullback long on EUR/USD after a range breakout:
A signal on the chart
EUR/USD — pullback long after a range breakoutEUR/USD4H
Thirty pips of risk against sixty of reward, framed by structure: the stop sits below the broken range high, where the long idea would be wrong.
Two execution details are pair-dependent and worth internalizing. First, fill quality: the faster the pair, the further your market order can travel between click and confirmation — this is slippage, a rounding error on EUR/USD in the overlap but a real cost on GBP/JPY during a data release. Second, reaction time: a signal loses a little edge for every second between generation and execution. This is why many signal traders eventually wire alerts straight into their platform through an MT4/MT5 connector, so the entry, stop and target are placed in milliseconds instead of after a phone-fumble.
Same Stop, Different Risk: Sizing by Pair
Here is the mistake that quietly bleeds accounts: trading the same lot size on every pair. It feels consistent. It is the opposite. Because pip values and stop distances differ by pair, a fixed lot size means your real dollar risk swings wildly from one signal to the next — small on a tight EUR/USD stop, oversized on a wide GBP/JPY one.
The professional habit inverts this: fix the risk, float the size. Choose the fraction of your balance a single signal may lose, then let the pair's stop distance and pip value determine the lots. Try it with your own numbers:
Fix risk, float size
Pair-aware position size
Fix your risk, then let the pair set the size. Switch the pip-value preset when you move between USD-quote and JPY-quote pairs.
Account balance
$
Risk per trade
Signal stop distance
pips
Pip value per standard lot
Risk per trade
—
Position size
—
Dollar value per pip
—
Double the stop distance and the correct size halves — same dollar risk on every pair, whatever the signal says.
Notice what this does to volatile pairs automatically: GBP/JPY signals carry wider stops, so the formula hands you fewer lots — you keep the pair's larger reward potential without letting it decide how much of your account is on the line. For the fuller version with account-currency conversion, use the forex position size calculator.
Leverage deserves one honest paragraph. It changes none of the math above — it only determines how large a position your margin allows, not what your risk should be. Traders get hurt when they let available leverage set their size instead of the stop distance. Treat leverage as plumbing, size from risk, and the number on your margin meter becomes boring — which is exactly what you want.
The Risk You Only See Across Pairs
Once you trade signals on more than one pair, a new risk appears that no single chart shows: correlation. Major pairs share currencies — above all the US dollar — so their moves overlap. A buy signal on EUR/USD and a buy on GBP/USD look like two independent ideas; most days they are one idea (dollar weakness) wearing two symbols — the same correlation cap our broader guide to risk management with AI forex signals treats as a hard rule, not a nuance. And because USD/CHF tends to mirror EUR/USD, a sell there is often that same bet in a third costume.
Hidden concentration
How major pairs tend to move together (illustrative)
5×5 matrix
Inverse
-1.0-0.50+0.5+1.0
Aligned
An illustrative pattern, not live data: EUR/USD and GBP/USD usually move together while USD/CHF mirrors them — long both majors plus short USD/CHF is one large short-dollar position, not three trades.
The fix is a habit, not a formula: before you take a new signal, glance at what you already hold. If the new pair shares a currency leg with an open position in the same direction, treat the two as one position and split your normal risk between them. This is also where automation helps at the portfolio level — a bot with a maximum-exposure rule per currency simply refuses the third disguised dollar trade, even when each signal looks fine in isolation.
Let the Bot Watch the Clock
Everything in this guide is knowledge you need once — but applying it is a per-trade chore: check the session, translate the stop into dollars, resize for the pair, scan for correlation, then execute fast enough that the entry still exists. That chore is precisely the layer worth automating, because none of it requires judgment at 2 a.m.; it requires consistency at 2 a.m.
A sensible division of labor looks like this: you choose the pairs whose personalities you understand, the risk fraction per trade, and the session windows you trust; the machine watches the feed, applies those rules identically on the hundredth trade as on the first, and places the order with its stop and target attached in milliseconds. Signals can reach you wherever you are — many traders run alerts through a forex signals mobile app with push notifications, then let platform-side automation handle the clicking when they are away from the desk.
What you should not delegate: pair selection and risk. A bot will faithfully execute a plan on a pair you don't understand — that is a fast way to automate a mistake. Master two or three pairs first, manually or on small size; automate what you already do deliberately.
FAQ
Which currency pair should I trade signals on first?
EUR/USD, and it is not close. It has the deepest liquidity of any pair, the tightest spreads, and the most orderly behavior around its session hours, which means your fills stay near the signal's quoted entry and your mistakes cost the least. Once EUR/USD execution feels routine, add one pair with a genuinely different personality — USD/JPY or GBP/JPY — rather than a near-clone like GBP/USD.
Can I execute a signal from one pair on a different pair?
No. A signal's direction, entry, stop distance and target are calibrated to one pair's volatility, spread and structure. Even highly correlated pairs differ in pip value and typical range, so a EUR/USD stop transplanted onto GBP/USD is mis-sized on arrival — and on a JPY cross the pip convention itself changes. Take signals only on the pair they were generated for.
Are crosses like GBP/JPY too volatile to trade with signals?
They are not too volatile — they are volatile differently, and the signal's framing plus your sizing must absorb that. Expect wider stops, wider spreads and faster moves; the position-size formula above automatically hands you fewer lots for the wider stop, which keeps the dollar risk identical to a calm EUR/USD trade. What crosses do punish is late, manual execution in fast markets.
When is the best time to trade EUR/USD signals?
The London–New York overlap — roughly 12:00 to 16:00 UTC — when both of the pair's home markets are open, books are deepest, and spreads are tightest. The London morning is a solid second. The hours after the New York close are the worst: thin liquidity, wider spreads, and fills that drift from the signal's entry. A session filter, human or automated, exists for exactly those hours.
How much should I risk on a single signal?
A small, fixed percentage of your balance — commonly somewhere around one percent — applied identically to every signal on every pair. The pair then changes your size, never your risk: wide-stop signals get fewer lots, tight-stop signals get more. What breaks accounts is not one bad signal; it is inconsistent risk meeting an ordinary losing streak.
We started with
“A buy alert on EUR/USD is only half of a trade”
and arrived at
You read the pair — mechanics, session, size — before the signal fires.
The signal picks the moment. You pick the pair.
A signal compresses analysis into four numbers, but those numbers only work on the pair they were generated for. Now that you can read a pair's quoting mechanics, personality and clock, every alert lands on prepared ground — whether you click the trade yourself or let a bot place it. The next layer is watching real signals arrive pair by pair, and timing your trading week around the hours that actually pay.
The Forex Desk is the SignalBots editorial team responsible for our currency-market coverage. We research and write the guides, explainers and reference articles on how the majors, minors and crosses actually trade — sessions, spreads, swaps and the macro releases that move price.



Discussions 0
Leave a comment