The near-term read (mid-July 2026): dollar-firm — DXY holds above the 100 handle in the upper half of its 2026 range while rate cuts stay priced out of the curve.
DXY is euro-heavy: use it as regime context, and always confirm direction on the specific pair you trade.
Hold weighted bull, base and bear scenarios with written flip-triggers, refreshed weekly from the five drivers: Fed repricing, inflation, risk sentiment, relative growth, positioning.
The outlook filters direction; live signals supply timing — take full size only where the two layers agree.
Table of Contents (30 min read)Contents
The Near-Term Outlook: Firm, Until Inflation Says Otherwise
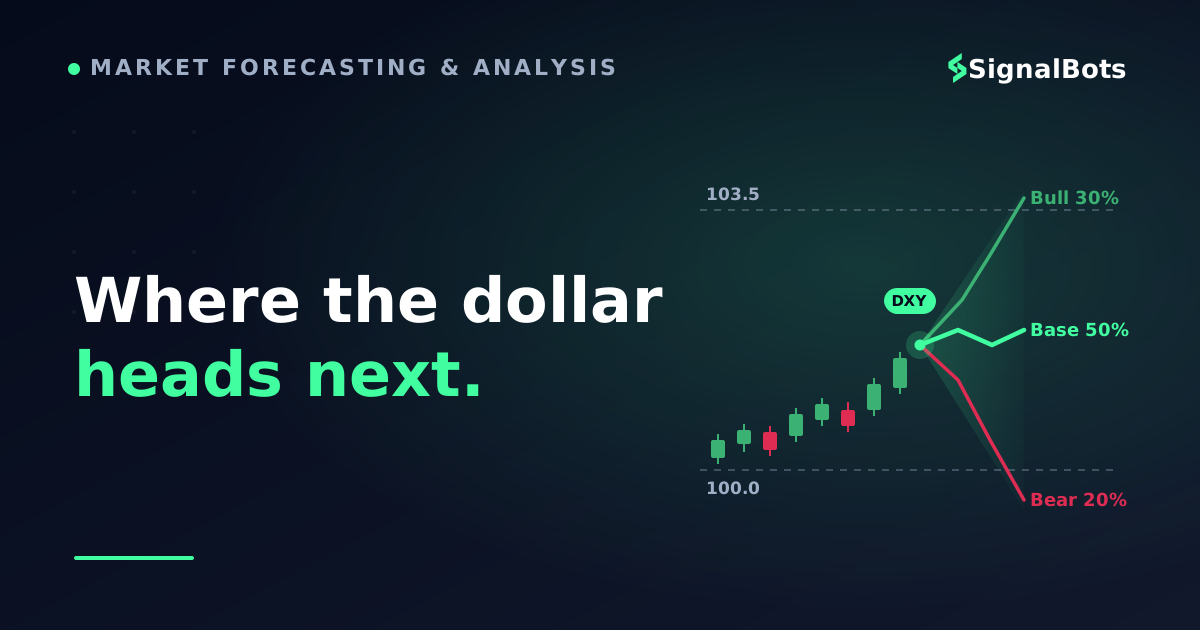
Where is the dollar headed? Near-term: sideways-to-higher. As of mid-July 2026 the US Dollar Index (DXY) comes into the summer firm — holding above the 100 handle, in the upper half of its 2026 range and near its highs for the year — after a second quarter in which sticky US inflation put "higher for longer" back into the curve and priced most of the Federal Reserve cuts markets had expected this year back out. Our base case, at roughly a 50% weight: DXY holds that upper half, grinding between the 100 area and the year's ceiling near 103.5 while cuts stay priced out. The bull case (about 30%): another hot inflation print or two forces the last of the cuts out of the curve and the index presses through the ceiling. The bear case (about 20%): soft prints stack up, cuts get repriced in, and — because the long-dollar trade is crowded — the unwind back below the 100 handle comes fast rather than orderly.
That read carries an expiry, and you should know exactly where it sits: the next inflation release or Fed meeting can reprice it in an afternoon. So this page hands you both halves of a usable forecast — the current call above, and the reading frame a professional desk uses to refresh it: the five forces that set dollar direction, a chart-regime read, and the scenario map behind those weights. Learn the frame once and you can update this outlook in any week of any year — then verify the timing on a real-time feed instead of trusting a paragraph that was true last Tuesday.
One more reason to care: if you trade forex at all, the dollar is the water you swim in. It sits on one side of every major pair, so the dollar read is the context behind almost every position you take — see our week-ahead major-pair forecast for how that context turns into pair-by-pair calls. Get it roughly right and ordinary entries get easier. Get it backwards and even clean setups fight the tide.
Why This Read Carries an Expiry Date
Study the weekly-forecast genre and a template emerges: a recap of last week's data, a paragraph of Fed commentary, next week's calendar, and one or two index levels near the end. None of it is wrong. It is simply perishable — a Friday forecast is a hostage to Tuesday's CPI, and a single surprise reprices the entire thesis, levels included.
There is a deeper issue than freshness. The dollar's medium-term path is genuinely uncertain even to the people setting policy — Fed officials publish a spread of their own projections rather than one number. When the source of the move won't commit to a point estimate, a trader shouldn't either. What a desk actually carries into the week is not "DXY will be at X" but a ranked set of scenarios, each tied to the conditions that would make it real.
The outlook at the top of this page is built exactly that way — a weighted scenario set with named triggers, not a point estimate. The rest of the page is the machine that produced it: section by section you'll see the driver read, the chart regime and the scenario map behind the weights, so that when the read expires — and it will — you can rebuild it in minutes rather than wait for someone else's rewrite.
What DXY Measures — and What It Doesn't
The index tracks the dollar against a fixed basket of major currencies, and the basket is lopsided: the euro alone carries the majority of the weight, with the yen, the pound and a few others sharing the rest. Two practical consequences follow.
First, to a rough approximation, DXY behaves like an inverted EUR/USD chart. When you think you are reading "the dollar," you are mostly reading the euro's mirror image. A euro-specific story — European growth surprising, ECB policy repricing — moves the index even when nothing has changed in America.
Second, "the dollar as a whole" can hide sharp internal divergence. The dollar can climb against the yen on rate differentials while slipping against the euro on growth optimism; DXY nets those into one number and throws the detail away. That is why the index is a context instrument, not an execution instrument: the outlook forms on DXY, but the trade lives on a specific pair, confirmed there by an actual forex trading signal rather than by the index reading alone.
The Five Forces That Set the Dollar's Direction
Every durable dollar move traces back to a short list of forces. The dashboard below maps each one in both directions — it is the lead instrument of this whole framework, the thing you actually consult each week before forming a view.
The driver dashboard
Driver
Dollar-positive when
Dollar-negative when
Where to watch it
Fed repricing
Cuts get priced out; “higher for longer” returns
A cutting cycle gets pulled forward
Fed funds futures vs the FOMC dot plot
Inflation & energy
Upside inflation surprises; an oil supply shock
Cooling prints stack up month after month
CPI releases, the crude oil trend
Risk sentiment
Stress anywhere bids for dollar liquidity
Calm, synchronized risk-on feeds carry trades
Equity volatility, credit spreads
Relative growth
US data keeps outrunning Europe and Asia
Rest-of-world growth closes the gap
PMIs and data-surprise trackers
Positioning
Crowded dollar shorts fuel squeeze rallies
Crowded longs leave breakouts exhausted
Weekly futures positioning reports
Every force reads in both directions. The near-term dollar outlook is whichever column is collecting more fresh evidence this week.
Run the dashboard as this page is written — mid-July 2026 — and the columns are lopsided. Fed repricing is dollar-positive and doing most of the work: the June FOMC held rates and published hawkish projections, and the cuts markets had priced for this year are mostly out of the curve. Inflation leans the same way — US prints have stayed sticky enough to keep "higher for longer" alive, which makes each CPI release the pivot the whole read hangs on. Risk sentiment is roughly neutral: geopolitical scares have eased and no stress is bidding for dollar liquidity. Relative growth still tilts American, though the gap has narrowed rather than widened. Positioning is the one caution flag: the long-dollar trade is crowded, so the first genuinely soft inflation surprise would unwind fast. Net those five out and you get the call at the top of the page — firm, upper half of the range, with the sharpest risk sitting on a downside surprise.
Fed repricing: the gravitational field
The single most important input is not the level of interest rates — it is the change in what markets price the Fed to do next, often called Fed repricing. When traders price rate cuts out of the curve (or start pricing hikes in), holding dollars pays relatively more and the index grinds higher; when a cutting cycle gets pulled forward, that support drains away. This is why the violent dollar moves cluster around inflation releases and FOMC meetings: those are the moments the pricing snaps to new information.
The practical read: before forming any dollar view, ask what is already priced. A hawkish Fed the market fully expects moves nothing; a mildly hawkish surprise against dovish pricing can move everything.
Inflation and energy shocks
Inflation sits upstream of the Fed, and energy sits upstream of inflation. A supply shock in crude can force "higher for longer" back into the curve within weeks, flipping the whole dollar regime with it — a chain reaction worth watching from its first link (the oil chart) rather than its last (the Fed statement). Symmetrically, a long run of cooling prints is what unlocks the cutting cycle that weakens the dollar. Single prints rarely matter; stacked, consecutive surprises in one direction do.
Risk sentiment and the dollar smile
The dollar has a famously non-linear relationship with global conditions, often sketched as the dollar smile: it strengthens at both extremes and sags in the middle. At one end, American growth outrunning the world attracts capital — dollar up. At the other end, genuine stress — geopolitical shocks, credit scares, liquidity squeezes — sends everyone scrambling for safe-haven dollar liquidity: dollar up again. The soggy middle is a calm, synchronized global recovery, where money leaks out of dollars into higher-yielding, riskier currencies. The counterintuitive rule that falls out: good news for the world is often bad news for DXY.
Relative growth: the exceptionalism trade
Because the index is a ratio, the non-dollar side matters exactly as much as the dollar side. US exceptionalism — American data persistently outrunning Europe and Asia — is a dollar bid even when the Fed does nothing, and its unwind is a dollar drag even when US data stays fine. Watch the gap between US and rest-of-world surprises, not the US numbers alone; DXY often turns when Europe's data merely stops disappointing.
Positioning and crowding
Finally, the market's own posture. When a dollar view becomes consensus, the marginal buyer or seller has already acted — which leaves the crowded side fragile. Heavily crowded dollar shorts turn routine hawkish surprises into squeeze rallies; crowded longs leave breakouts exhausted just past the range edge. Positioning rarely picks the direction, but it reliably shapes the speed and violence of the move once one of the other four forces fires.
Reading the DXY Chart Like a Desk Trader
With the drivers in hand, the chart's job is to tell you which regime you are in — not to hand you entries. Three references do most of the work: the long-term moving-average area (the market's slow consensus) and the floor and ceiling of the prevailing multi-month range. On DXY right now those references are well defined: a floor near 97 where the spring lows based out, a ceiling just above 103.5 at the year's highs, and the 200-day area just above 100 — with the index trading above all but the ceiling, in the upper half of the range. The map below draws that structure.
DXY — the 2026 regime map (levels approximate)DXYDaily
The regime as of mid-July 2026: DXY above the 200-day area and the 100 handle, in the upper half of the year's range between the spring floor near 97 and the ceiling near 103.5. Levels are approximate — verify on a live chart before acting.
Range edges resolve one of two ways, and the driver stack is the tiebreaker. A push into the ceiling with hawkish repricing behind it is breakout material; the same push on quiet news, with positioning already stretched, is the classic fade. Whichever way you lean, check the read across at least two timeframes — multi-timeframe confirmation filters out the single-chart illusions a daily-only view produces — and remember that execution belongs on the pair, not on the index.
Hold Three Scenarios, Not One Opinion
Professional desks don't carry a prediction; they carry a distribution. The tool for that is a three-scenario map — bull, base, bear — each tied to the specific driver conditions that would make it the live one, and each carrying a weight. Below is ours as of mid-July 2026, weighted to match the driver read above. Your weekly job is not to guess right. It is to notice, faster than most, which scenario the incoming evidence is feeding — and to move the weights when it does.
DXY — the near-term scenario map
Bull case30%
Breaks the ceiling near 103.5
Another hot CPI or two forces the last of this year's cuts out of the curve
An energy or geopolitical shock adds a safe-haven bid on top of the rate story
US data keeps outrunning Europe and Asia
Base case50%
Holds the upper half: 100 to 103.5
Inflation stays sticky; the Fed holds with hawkish projections and cuts stay priced out
Pushes toward the ceiling stall — crowded long positioning caps the momentum
Week-to-week swings come from positioning, not fresh news
Bear case20%
Unwinds back below the 100 handle
Soft inflation prints stack up and rate cuts get repriced into the curve
Crowded dollar longs turn the first clear miss into a fast, disorderly unwind
The euro side of the basket strengthens on its own
Our weights as of mid-July 2026 — a snapshot, not a promise. Refresh them each week from the driver dashboard above, and move them the moment a written trigger fires.
Two disciplines make the map work. First, write down — in advance — the trigger that flips you between scenarios: "two consecutive hot inflation prints move me to the bull case," "a dovish dissent at the FOMC moves me toward the bear case." A written trigger fires; a vague feeling gets rationalized away. Second, let the scenarios disagree with your position. The moment you catch yourself feeding every data point into the scenario you are positioned for, the map has stopped working.
From Outlook to Trades
An outlook is a filter, not a trigger. It tells you which side of the dollar you are allowed to be on this week — it says nothing about this hour's entry. That timing layer is what a trading signal supplies: a concrete, machine-generated entry with a defined signal direction that you can align — or refuse to align — with your scenario.
The alignment rule is mechanical. Signals whose direction agrees with your live scenario are candidates at full planned size. Counter-scenario signals are not automatically wrong — mean reversion happens inside every regime — but they should clear a higher bar: demand a stronger signal confidence score, cut the size, or skip them entirely. You are stacking two independent layers, macro filter and execution timing, and only committing where they agree.
Then comes expression. A dollar-bearish scenario translates most cleanly into strength in the basket's heavyweight — live EUR/USD signals are the highest-fidelity mirror of a falling index. A rate-differential story tends to express loudest in the yen, where USD/JPY signals pick up the policy-gap moves the index dilutes.
Be deliberate around CPI mornings and FOMC afternoons: spreads widen and whipsaws multiply, which is exactly what a news filter exists to sit out. Expect signal frequency to swell in the sessions after a macro release and thin out in quiet hours — a change in flow is information, not a malfunction.
And size every entry before it arrives. The forex position size calculator turns scenario conviction into a defensible risk-per-trade number instead of an impulse. If you would rather watch the flow before acting on it, the forex Telegram signal channel mirrors the feed in a form you can observe first.
Your Weekly Dollar Refresh
Everything above compresses into a routine that takes less time than reading one dated forecast — and unlike the forecast, it is yours and it is always current. Run it before the week opens:
Weekly dollar outlook refresh
0 / 8
Check what the market prices for the next Fed meeting — and how that pricing changed this week
Scan the week's calendar for CPI, jobs and FOMC events that can reprice the dollar
Read the risk tone: are equities and credit calm, or is stress bidding for dollars?
Note whether US data is still outrunning Europe and Asia, or the gap is closing
Locate DXY against its range edges and the 200-day area
Pick the scenario — bull, base or bear — that this week's evidence actually feeds
Write down the specific trigger that would flip you to the next scenario
Confirm direction on the pair you trade, and size the position before the first signal fires
★
Checklist complete — you’re cleared to proceed.
FAQ
Is DXY the same thing as "the US dollar"?
No. DXY is one specific, euro-dominated basket. The dollar can strengthen against the yen while the index falls, or the index can rally purely on euro weakness while other dollar pairs barely move. Treat DXY as a convenient summary of the dollar's broad tone and always confirm direction on the pair you intend to trade.
Can you trade the dollar index directly?
Index futures and some CFD products track DXY, but most retail traders express a dollar view through the major pairs instead — liquidity is deeper, costs are usually lower, and signal coverage lives there. EUR/USD is the closest single-pair proxy because the euro dominates the basket's weight.
What is the single most important driver of near-term direction?
Fed repricing — the change in what markets price the Fed to do next, not the level of rates itself. The sharpest dollar moves happen when incoming data forces that pricing to snap: an inflation surprise, a labor-market shock, or a Fed meeting that lands off-script. If you monitor only one thing between weekly refreshes, monitor that.
How far ahead can a dollar outlook realistically see?
Honestly: until the next major repricing event, which usually means days to a few weeks. That is not a weakness of this framework — it is the nature of the asset, and it is why the read at the top of this page carries stated weights and named flip-triggers instead of a single frozen target. Scenario weights are meant to be updated as evidence arrives, not defended after it contradicts them.
Should I trade against a crowded dollar position?
Not on crowding alone. Positioning is an accelerant, not a signal: it tells you which direction will move violently if a driver fires, not when that will happen. Crowded shorts plus a hawkish surprise is a squeeze; crowded shorts plus nothing is just a quiet week. Wait for the driver, then let positioning size your expectations for the move.
How do trading signals fit a macro dollar view?
They occupy different layers. The outlook filters direction — which side of the dollar you are willing to be on. Signals supply timing — concrete entries with defined direction and confidence on specific pairs. The disciplined combination is to take full-size entries only where both layers agree, and to shrink or skip trades that fight your live scenario.
We started with
“Where is the US dollar headed next?”
and arrived at
Firm above the 100 handle — with the frame to refresh that read weekly.
A dollar outlook is a process you own — not a paragraph you rent
You leave this page with both halves of a usable forecast: the current call — dollar-firm, upper half of the range, watching inflation — and the machine that produced it. The call will expire; the driver dashboard, the regime chart and the weighted scenario map will not. Run the refresh, move the weights as evidence arrives, then let live signal data time the entries your outlook allows.
The Forex Desk is the SignalBots editorial team responsible for our currency-market coverage. We research and write the guides, explainers and reference articles on how the majors, minors and crosses actually trade — sessions, spreads, swaps and the macro releases that move price.



Discussions 0
Leave a comment