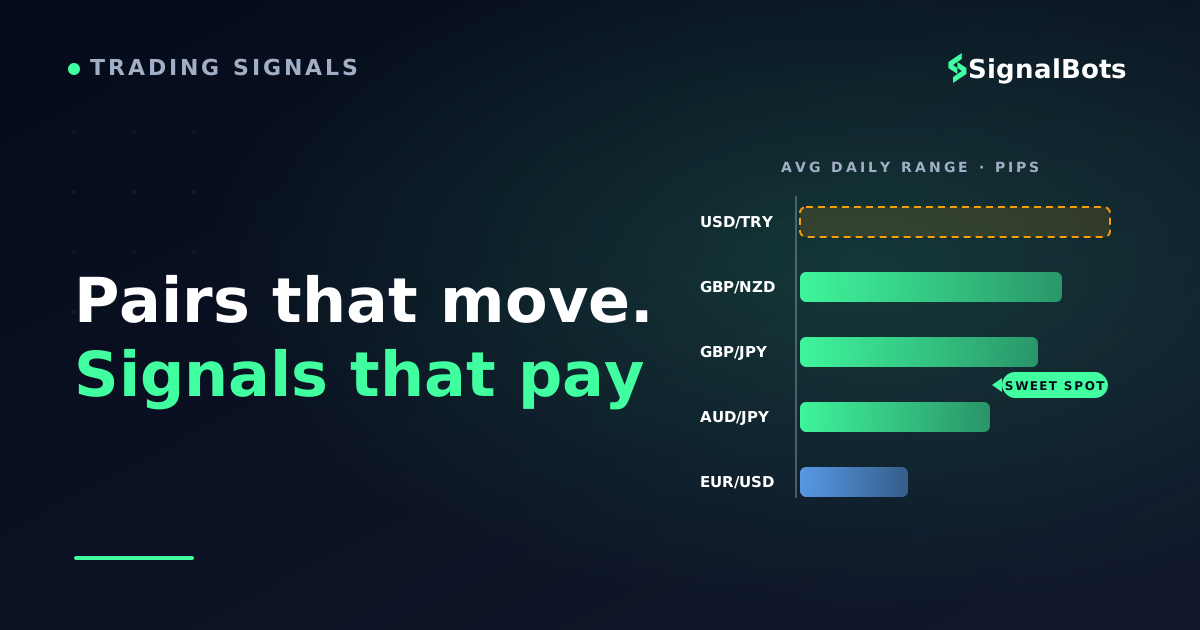
Ask which forex pairs move the most and you will hear a familiar list: GBP/JPY, GBP/NZD, AUD/JPY, and — out at the extreme — exotic pairs such as USD/ZAR and USD/TRY. That part is easy, and it is where most volatility rankings stop. The question that actually decides your results is different: when a trading signal fires on one of those pairs, how much of the move can you actually capture after the spread, the slippage, and a stop wide enough to survive the noise?
This guide answers both halves. First, the ranking itself — which pairs genuinely move most, and why. Then the half most rankings skip: which of those pairs a signal trader can realistically execute on, how position sizing changes when stops triple in width, and at what hours each pair does its moving.
Key Takeaways
Sterling and yen crosses (GBP/JPY, GBP/NZD, AUD/JPY) top the volatility rankings among liquid pairs; exotics move even more but cost far more to trade.
Raw range is not edge: judge a pair by its spread relative to a typical signal target, because friction is collected on every trade.
Volatile pairs demand volatility-sized stops and smaller positions — keep cash risk constant and let lot size float with stop distance.
Volatility clusters by session: match a pair's active hours to the hours you can actually act on its signals.
Table of Contents (33 min read)Contents
The Short Answer: Crosses Move Most, Majors Move Cleanest
If you take one thing from this page, take the tiering:
Exotic pairs (USD/ZAR, USD/TRY, USD/MXN) post the largest raw moves in forex, driven by inflation cycles, political shocks, and thin liquidity. They top the volatility charts — and sit at the bottom of every practical signal watchlist, for reasons we will get to.
Volatile crosses (GBP/JPY, GBP/NZD, GBP/AUD, AUD/JPY, CAD/JPY, NZD/JPY) are the working sweet spot: wide daily ranges backed by enough liquidity that the movement is actually tradeable.
The livelier majors (GBP/USD, and USD/JPY when central-bank policy is in play) move less than the crosses but cost almost nothing to trade.
The calm end (EUR/USD, USD/CHF, EUR/CHF) delivers the tightest ranges and the tightest costs — slower, but cleaner.
For signal-driven trading specifically, the answer is narrower than "whatever tops the chart": the sterling and yen crosses give you the most movement you can actually keep. The rest of this article is the case for that claim — and the mechanics of trading it well.
What Volatility Means When a Signal Fires
Volatility is the size of a pair's typical movement, not its direction. Most traders meet it through Average True Range (ATR) — the average size of a bar's full trading range over a lookback window, commonly 14 periods. When ATR expands, the pair is covering more ground per bar; when it contracts, the pair is idling. No published ranking beats simply pulling the ATR of the pairs you trade and comparing them on the same timeframe.
For a signal trader, that one number quietly rewrites four parts of every trade:
Stop distance. A stop that survives EUR/USD noise gets clipped on GBP/JPY within hours. Stops on volatile pairs must scale with the pair's range — which is why well-built signals set them from current volatility, not from a fixed pip count.
Target distance. The same logic works in your favor on the profit side: a volatile pair can reach a target in one session that a quiet pair needs a week to reach.
Time to resolution. Volatile pairs answer the question faster. Win or lose, capital is released and the next signal can be taken.
Whipsaw risk. More movement means more noise, and more noise means more false signals — breakouts that trigger, travel a few pips, and reverse. Volatility raises the stakes in both directions.
Here is what those trade-offs look like on an actual setup:
Worked example
GBP/JPY — breakout long, sized to the pair's rangeGBP/JPY4H
An illustrative GBP/JPY breakout. The setup logic is the same as on a quiet major — but the stop must clear this pair's normal noise, so it sits far wider, and the position size must shrink to match.
Notice what did not change in that example: the setup logic. A breakout above a range high with a stop below structure works the same way on any pair. What changed is the arithmetic wrapped around it — the stop is wide enough that a EUR/USD-sized position would risk several times your intended amount, and the target is far enough away that the trade can pay for that width. Volatile pairs don't need different signals; they need different numbers around the same signals — the six-field anatomy stays exactly what our guide on what forex signals are and how they work describes.
The Volatility Map, Pair by Pair
The map
Pair group
Typical movement
Execution cost
Most active (UTC)
Signal verdict
GBP/JPY · GBP/NZD · GBP/AUD
Very high
Low to moderate
07:00–16:00
Best all-round for signal trading
AUD/JPY · CAD/JPY · NZD/JPY
High
Low to moderate
00:00–09:00, then 12:00–16:00
Strong — risk-sentiment driven
GBP/USD · EUR/JPY
Moderate to high
Low
07:00–16:00
Solid range at major-pair cost
EUR/USD · USD/JPY · USD/CHF
Low to moderate
Lowest
07:00–21:00
Cleaner but slower — anchor pairs
USD/ZAR · USD/TRY · USD/MXN
Extreme
High, and unstable
Local news + NY hours
Movement rarely survives the costs
Movement and cost tiers are qualitative by design — pull the current ATR of any pair before trading it, because volatility regimes shift.
GBP/JPY is the flagship, and its old trading-floor nickname — "the Dragon" — is earned. It pairs two currencies that both attract speculative flow: sterling reacting sharply to UK data and Bank of England policy, and the yen acting as the market's risk barometer. When risk sentiment turns, the two forces often push the same direction at once — sterling sold, yen bought — and the pair covers enormous ground. Crucially, it does so with deep liquidity behind it, which is what keeps the movement tradeable. To see how entries and stops are sized to exactly this behavior, watch the live GBP/JPY signals feed for a few sessions.
GBP/NZD and GBP/AUD run wider still on many days. Neither leg is the US dollar, so order books are thinner than on any major, and the same headline travels further through price. They trend hard when UK and antipodean rate expectations diverge — but expect meaner spikes and slightly rougher fills than on GBP/JPY.
AUD/JPY, CAD/JPY, and NZD/JPY are the market's risk-on/risk-off thermometers: a commodity-linked currency on one side, the classic safe haven on the other. They move with equity sentiment and macro headlines, and — unusually for forex — they are lively during Pacific and Tokyo hours, which makes them the volatile pairs of choice for traders in Asia-Pacific time zones.
GBP/USD is the most volatile of the true majors, and EUR/JPY behaves like a slightly tamer yen cross. Both offer a genuine compromise: meaningful range at near-major execution cost.
EUR/USD, USD/JPY, and USD/CHF anchor the calm end. The world's deepest currency market produces cleaner, better-behaved moves — smaller, but cheap to trade and forgiving of imperfect timing. There is a reason most traders calibrate their process here first.
The exotics — USD/ZAR, USD/TRY, USD/MXN — genuinely do move the most. High local inflation, political risk, and commodity exposure produce swings that dwarf anything a cross can print. Whether you can keep any of that movement is the next section.
Why the Biggest Mover Isn't the Best Signal Pair
A signal's edge is what remains after friction, and friction has three names: the spread, slippage, and delivery delay. Volatility rankings ignore all three. Your trade log will not.
Think of the spread as a toll collected on every entry, win or lose. Suppose — as a purely illustrative example — a liquid cross quotes 2 pips wide while your signal targets 80 pips: the toll is a rounding error. Now suppose an exotic quotes 40 pips wide against a 300-pip target: the toll is a meaningful slice of your best case, and unlike the target, it is collected on every single trade. Stack slippage from a thin order book on top — worst exactly when the pair is moving fastest, which is when your signals fire — and the "most volatile" pair quietly becomes the most expensive one.
Speed compounds the problem. On a fast pair, a signal ages quickly: an entry that was excellent when generated can be mediocre thirty seconds later. That is why signal latency matters most on exactly the pairs this article is about — volatile pairs reward fast delivery and punish slow relays hardest.
Two volatile pairs, two very different signal trades
Winner
GBP/JPY — volatile and deep
Wide daily ranges with deep liquidity behind every tick
Spread stays a small slice of a typical signal target
Fills land close to the signal price in normal conditions
Movement persists, so a slightly late entry can still work
Movement you can actually keep — the signal trader's sweet spot
VS
USD/TRY — volatile and thin
Huge raw moves driven by inflation and policy shocks
Spread can swallow a large share of any realistic target
Thin books mean slippage exactly when signals fire
Gaps and one-way moves punish late entries hard
Impressive on a chart, expensive in a trade log
Same headline volatility story, opposite outcomes once execution costs are counted.
The test to carry with you: compare a pair's spread to its typical signal target, not to other spreads. A 2-pip spread against an 80-pip target beats a 1-pip spread against a 15-pip target — and demolishes a 40-pip spread against a 300-pip one. Movement per unit of friction is the ranking that pays.
Sizing a Signal to the Pair's Range
The most common way traders get hurt moving from majors to volatile crosses is not the pair — it is carrying the same lot size across, the exact trap our guide on sizing signals by currency pair walks through in detail. If your risk per trade is fixed, the arithmetic is unforgiving: a stop three times wider demands a position roughly one-third the size. Same cash at risk, same signal logic — smaller lots.
Run your own numbers and watch the relationship:
Try the numbers
Volatility-Adjusted Position Size
Same account, same risk — see how the lot size must shrink as the stop widens to match a more volatile pair.
Account balance
$
Risk per trade
Stop distance
Pip value per standard lot
$
Cash at risk
—
Position size
—
Risk per pip
—
Widen the stop from 25 to 80 pips and watch the lot size fall — the cash at risk never moves. That is volatility-adjusted sizing in one slider.
Two practical notes. First, pip value itself differs by pair — on yen pairs especially — so recompute it rather than assuming the EUR/USD figure; the full forex position size calculator handles per-pair pip values and lot-step rounding end to end. Second, resize before the first trade on a new pair, not after the first oversized loss teaches you why.
When Volatile Pairs Actually Move
Volatility is not spread evenly across the day, and this is where many signal traders quietly sabotage themselves: they pick the right pair and trade it at the wrong hours. Sterling pairs do the bulk of their moving from the London open through the London–New York overlap. The yen crosses get a second, earlier window — AUD/JPY and NZD/JPY often make their move while Sydney and Tokyo trade together, long before London wakes.
FX sessions — when the volatile pairs wake up (UTC)24-hour clock · times in UTC
UTC timeline
SydneyTokyoLondonNew York
21:00–24:0021:0000:00–6:00–6:00
0:00–9:000:00
7:00–16:007:00
12:00–21:0012:00
000306091215182124
Sydney + Tokyo0:00–6:00 UTC · Yen-cross early window
London + New York12:00–16:00 UTC · Peak range for GBP pairs
Sydney
Tokyo
London
New York
Overlap (peak liquidity)
Sterling pairs concentrate their range between the London open and the end of the London–New York overlap. Yen crosses get a second, earlier window while Sydney and Tokyo overlap.
For a signal trader this timing has one concrete consequence: signal frequency follows the sessions. A strategy scanning GBP/JPY will produce most of its setups inside the London window, because that is when the conditions it looks for actually occur. If your available hours are fixed — a day job, a time zone — choose pairs whose active window overlaps your own, not the most volatile pair in the abstract. An AUD/JPY signal you can act on within seconds beats a GBP/NZD signal you find three hours stale.
Building Your Signal Watchlist
Pulling the threads together, a volatility-aware watchlist is built in five moves:
Anchor with one or two majors. EUR/USD or USD/JPY give you a calibration baseline — signals behave cleanly and execution costs are minimal, so any problems you see are process problems, not pair problems.
Add two or three volatile crosses that match your hours. Available during London and New York? GBP/JPY plus one wider sterling cross. Trading from Asia-Pacific? AUD/JPY and NZD/JPY move on your schedule.
Resize before the first trade. Set the stop from the pair's current range, then derive the lot size from your fixed cash risk — never the other way around.
Track your fills against the signal prices. The gap between them is your personal friction number for each pair. A pair whose friction eats a meaningful share of a typical target earns a demotion, whatever the rankings say.
Leave the exotics until everything else is measured. If you still want USD/ZAR after seeing your realized costs on GBP/NZD, at least you will enter with open eyes — and a small size.
One last delivery note: on fast pairs, how a signal reaches you matters nearly as much as which pair it covers. If you take entries through chat rather than a dashboard, a forex Telegram signal channel with timestamped entries lets you check how old a signal is before you act on it — the difference between trading the move and chasing it.
FAQ
Is GBP/JPY the most volatile forex pair?
Among liquid pairs, it is the usual flagship — sterling's event-sensitivity multiplied by the yen's risk-barometer role produces consistently wide ranges, and GBP/NZD and GBP/AUD often run wider still. Exotics like USD/TRY and USD/ZAR move more in raw terms. Rankings also shuffle as macro regimes change, so treat any fixed list as a snapshot: pull a current ATR comparison before committing capital.
Are exotic pairs like USD/TRY good for signal trading?
Rarely. The movement is real, but the execution environment — wide and unstable spreads, thin order books, slippage at news time, and occasional one-way moves — consumes a large share of whatever a signal captures. Most signal traders get a better movement-per-cost ratio from sterling and yen crosses. If you trade exotics at all, do it with reduced size and measured expectations about fills.
Should I use the same lot size on volatile pairs as on EUR/USD?
No — this is the single most expensive habit to carry across. Keep cash risk per trade constant and let lot size float with stop distance: a stop three times wider means roughly one-third the lots. The wider stop is not extra caution, it is the minimum the pair's normal noise demands; the smaller size is what makes that stop affordable.
Do volatile pairs produce more trading signals?
Usually yes — more movement means strategy conditions trigger more often, so expect a higher signal count on GBP/JPY than on EUR/CHF from the same logic. But frequency is not quality: the same noise that fires more setups also produces more failed breaks. Judge a pair by the outcomes of its signals over a meaningful sample, not by how busy it keeps you.
We started with
“Which forex pairs move most — and are they worth signal trading?”
and arrived at
Liquid volatile crosses, traded in their active hours and sized to their range.
Volatility is the raw material — execution turns it into results
The ranking was never the hard part: sterling and yen crosses out-move the majors, and exotics out-move everything. What separates a signal trader from a spectator is everything wrapped around that list — choosing the pairs whose movement survives the spread, acting inside the hours when that movement actually happens, and cutting position size so a wider stop risks the same cash. Get those three right and volatility stops being a threat and becomes the reason your signals have room to work.
The Forex Desk is the SignalBots editorial team responsible for our currency-market coverage. We research and write the guides, explainers and reference articles on how the majors, minors and crosses actually trade — sessions, spreads, swaps and the macro releases that move price.



Discussions 0
Leave a comment