Global Indices Signals

FTSE 100 (UK) Trading Signals

Real-time FTSE 100 (UK) signals with a full trade plan: entry, stop-loss, and take-profit targets, delivered in under 10ms on the web, Telegram, our browser extension and mobile app.

Live Signals
LIVE Last FTSE 100 (UK) signal 5 active now
Performance

Recent Results: Global Indices

Per-symbol net percentage outcome by day across the last 30 trading sessions. Filter to a symbol to isolate its track.

Monthly Summary: Global Indices Click to toggle
Month, Year Total (Net %) UK
Month-to-date 423.0 423.0
September 2026 425.0 425.0
August 2026 141.0 141.0
July 2026 141.0 141.0
June 2026 185.0 185.0

Disclaimer: Past performance does not guarantee future results, and the results shown here represent historical outcomes only and may not be repeated. Please trade and invest with caution; the information provided is for informational purposes only and does not constitute investment or trading advice.

Direction
Get every FTSE 100 (UK) signal instantly Web, Telegram, browser extension, and mobile app, all included on any plan.
FTS/GBP 1 Minute
Buy
Entry 10730.21
Stop Loss 10726.56
TP1 10733.86
TP2 10737.50
TP3 10741.15
TP4 10744.79
Loss #130306
FTS/GBP 1 Minute
Buy
Entry 10748.70
Stop Loss 10744.80
TP1 10752.60
TP2 10756.50
TP3 10760.39
TP4 10764.29
Loss #130299
FTS/GBP 5 Minutes
Buy
Entry 10691.39
Stop Loss 10680.32
TP1 10702.46
TP2 10713.54
TP3 10724.61
TP4 10735.68
TP4 Hit #130280
FTS/GBP 1 Minute
Sell
Entry 10691.40
Stop Loss 10696.35
TP1 10686.45
TP2 10681.51
TP3 10676.56
TP4 10671.61
TP2 Hit #130123
FTS/GBP 4 Hours
Buy
Entry 10691.40
Stop Loss 10622.03
TP1 10760.77
TP2 10830.13
TP3 10899.50
TP4 10968.86
VIP Clients Only
Active #130134
FTS/GBP 1 Hour
Buy
Entry 10698.65
Stop Loss 10639.02
TP1 10758.28
TP2 10817.91
TP3 10877.55
TP4 10937.18
VIP Clients Only
Active #130097
FTS/GBP 4 Hours
Buy
Entry 10689.30
Stop Loss 10622.20
TP1 10756.40
TP2 10823.51
TP3 10890.61
TP4 10957.71
VIP Clients Only
Active #130056
FTS/GBP 5 Minutes
Sell
Entry 10681.85
Stop Loss 10696.82
TP1 10666.88
TP2 10651.90
TP3 10636.93
TP4 10621.96
TP2 Hit #129923
FTS/GBP 5 Minutes
Sell
Entry 10684.52
Stop Loss 10697.85
TP1 10671.19
TP2 10657.86
TP3 10644.54
TP4 10631.21
TP3 Hit #129880
Trade Ledger

Last 20 Signals: Global Indices

Date, time Order Price Take Profit Stop Loss State Entry Exit Profit
October 29, 2026 at 10:25 AM GMT Oct 29, 26 10:25 GMT Buy 10730.21 10733.86, 10737.50, 10741.15, 10744.79 10726.56 Loss 10730.21 10726.56 -36500
October 29, 2026 at 8:40 AM GMT Oct 29, 26 08:40 GMT Buy 10748.70 10752.60, 10756.50, 10760.39, 10764.29 10744.80 Loss 10748.70 10744.80 -39000
October 28, 2026 at 4:30 PM GMT Oct 28, 26 16:30 GMT Buy 10691.39 10702.46, 10713.54, 10724.61, 10735.68 10680.32 TP4 Hit 10691.39 10735.68 +442900
October 28, 2026 at 4:00 PM GMT Oct 28, 26 16:00 GMT Sell 10691.40 10686.45, 10681.51, 10676.56, 10671.61 10696.35 TP2 Hit 10691.40 10681.51 +98900
October 28, 2026 at 4:00 PM GMT Oct 28, 26 16:00 GMT Buy 10691.40 10760.77, 10830.13, 10899.50, 10968.86 10622.03 Active - - -
October 28, 2026 at 1:00 PM GMT Oct 28, 26 13:00 GMT Buy 10698.65 10758.28, 10817.91, 10877.55, 10937.18 10639.02 Active - - -
October 27, 2026 at 8:00 PM GMT Oct 27, 26 20:00 GMT Buy 10689.30 10756.40, 10823.51, 10890.61, 10957.71 10622.20 Active - - -
October 27, 2026 at 4:10 PM GMT Oct 27, 26 16:10 GMT Sell 10681.85 10666.88, 10651.90, 10636.93, 10621.96 10696.82 TP2 Hit 10681.85 10651.90 +299500
October 27, 2026 at 12:20 PM GMT Oct 27, 26 12:20 GMT Sell 10684.52 10671.19, 10657.86, 10644.54, 10631.21 10697.85 TP3 Hit 10684.52 10644.54 +399800
October 27, 2026 at 12:15 PM GMT Oct 27, 26 12:15 GMT Sell 10681.17 10679.53, 10677.90, 10676.26, 10674.63 10682.81 TP1 Hit 10681.17 10679.53 +16400
October 27, 2026 at 12:00 PM GMT Oct 27, 26 12:00 GMT Buy 10683.22 10744.87, 10806.51, 10868.16, 10929.80 10621.57 Active - - -
October 27, 2026 at 8:40 AM GMT Oct 27, 26 08:40 GMT Sell 10664.94 10660.61, 10656.28, 10651.95, 10647.62 10669.27 TP3 Hit 10664.94 10651.95 +129900
October 26, 2026 at 12:00 PM GMT Oct 26, 26 12:00 GMT Buy 10731.05 10840.30, 10949.55, 11058.80, 11168.05 10621.80 Active - - -
October 26, 2026 at 10:20 AM GMT Oct 26, 26 10:20 GMT Buy 10733.06 10739.54, 10746.01, 10752.49, 10758.97 10726.58 TP4 Hit 10733.06 10758.97 +259100
October 26, 2026 at 8:30 AM GMT Oct 26, 26 08:30 GMT Buy 10730.53 10734.95, 10739.37, 10743.79, 10748.21 10726.11 TP4 Hit 10730.53 10748.21 +176800
October 23, 2026 at 7:00 PM GMT Oct 23, 26 19:00 GMT Buy 10670.57 10723.42, 10776.26, 10829.11, 10881.95 10617.72 TP1 Hit 10670.57 10723.42 +528500
October 23, 2026 at 1:50 PM GMT Oct 23, 26 13:50 GMT Sell 10659.39 10654.87, 10650.36, 10645.84, 10641.33 10663.91 TP1 Hit 10659.39 10654.87 +45200
October 23, 2026 at 12:00 PM GMT Oct 23, 26 12:00 GMT Sell 10675.91 10670.39, 10664.87, 10659.36, 10653.84 10681.43 TP4 Hit 10675.91 10653.84 +220700
October 23, 2026 at 8:35 AM GMT Oct 23, 26 08:35 GMT Sell 10692.36 10684.54, 10676.71, 10668.89, 10661.06 10700.18 TP4 Hit 10692.36 10661.06 +313000
October 22, 2026 at 7:00 PM GMT Oct 22, 26 19:00 GMT Buy 10723.55 10785.61, 10847.68, 10909.74, 10971.80 10661.49 Loss 10723.55 10661.49 -620600
Binary Options

FTSE100 Binary Signals

The binary options record for FTSE100: strike, direction and expiry on every call, settled Win, Loss or Tie.

Performance

Recent Results: Binary Options

Wins and losses by day across the last 30 trading sessions. Filter to a symbol to isolate its track.

Monthly Summary: Binary Options Click to toggle
Month, Year Total (Payout pts) FTSE100
Month-to-date 1,400 1,400
September 2026 560 560
August 2026 165 165
July 2026 135 135
June 2026 0 -

Binary Options Signal Cards

FTSE100 4 Hours
Strike 10691.39
Expiry 4 Hours
Strategy SB Rules v1
VIP Clients Only
Active #130288
FTSE100 1 Hour
Put
Strike 10691.39
Expiry 1 Hour
Strategy SB Rules v1
Loss #130286
FTSE100 5 Minutes
Call
Strike 10691.39
Expiry 5 Minutes
Strategy SB Rules v1
Win #130281
FTSE100 30 Minutes
Call
Strike 10691.39
Expiry 30 Minutes
Strategy SB Rules v1
Win #130284
FTSE100 1 Hour
Put
Strike 10689.3
Expiry 1 Hour
Strategy SB Rules v1
Win #130053
FTSE100 5 Minutes
Put
Strike 10689.3
Expiry 5 Minutes
Strategy SB Rules v1
Win #130049
Trade Ledger

Last 20 Signals: Binary Options

Date, time Direction Strike Expiry State Result Payout
October 28, 2026 at 8:00 PM GMT Oct 28, 26 20:00 GMT Long 10691.39 4 Hours Open Active -
October 28, 2026 at 5:00 PM GMT Oct 28, 26 17:00 GMT Short 10691.39 1 Hour Settled Loss -100
October 28, 2026 at 4:30 PM GMT Oct 28, 26 16:30 GMT Long 10691.39 30 Minutes Settled Win +85
October 28, 2026 at 4:30 PM GMT Oct 28, 26 16:30 GMT Long 10691.39 5 Minutes Settled Win +85
October 27, 2026 at 5:00 PM GMT Oct 27, 26 17:00 GMT Short 10689.3 1 Hour Settled Win +85
October 27, 2026 at 4:30 PM GMT Oct 27, 26 16:30 GMT Short 10689.3 5 Minutes Settled Win +85
October 23, 2026 at 7:00 PM GMT Oct 23, 26 19:00 GMT Long 10670.57 4 Hours Settled Win +85
October 22, 2026 at 11:00 AM GMT Oct 22, 26 11:00 GMT Long 10705.55 30 Minutes Settled Win +85
October 21, 2026 at 7:00 PM GMT Oct 21, 26 19:00 GMT Long 10751.91 4 Hours Settled Loss -100
October 21, 2026 at 12:00 PM GMT Oct 21, 26 12:00 GMT Long 10739.49 1 Hour Settled Win +85
October 21, 2026 at 11:30 AM GMT Oct 21, 26 11:30 GMT Long 10737.93 30 Minutes Settled Win +85
October 20, 2026 at 7:00 PM GMT Oct 20, 26 19:00 GMT Long 10731.16 4 Hours Settled Win +85
October 20, 2026 at 3:30 PM GMT Oct 20, 26 15:30 GMT Short 10731.16 5 Minutes Settled Win +85
October 19, 2026 at 7:00 PM GMT Oct 19, 26 19:00 GMT Long 10765.13 4 Hours Settled Loss -100
October 19, 2026 at 8:00 AM GMT Oct 19, 26 08:00 GMT Short 10792.84 1 Minute Settled Win +85
October 15, 2026 at 8:00 AM GMT Oct 15, 26 08:00 GMT Long 10768.43 1 Minute Settled Win +85
October 9, 2026 at 3:30 PM GMT Oct 9, 26 15:30 GMT Long 10560.03 5 Minutes Settled Win +85
October 9, 2026 at 3:30 PM GMT Oct 9, 26 15:30 GMT Long 10560.03 1 Minute Settled Win +85
October 8, 2026 at 8:00 AM GMT Oct 8, 26 08:00 GMT Short 10393.34 1 Minute Settled Win +85
October 7, 2026 at 3:30 PM GMT Oct 7, 26 15:30 GMT Short 10457.37 5 Minutes Settled Win +85
FAQs

Common questions about FTSE 100 (UK) signals

How fast do signals reach me?

Every signal pushes to you in under 10 milliseconds from when our engine fires. It lands on the web dashboard, Telegram, our browser extension, and the mobile app at the same time, so you never miss an entry.

What global indices markets do you cover?

Every global indices instrument with a live track record shows up as a card on this page, busiest first. Tap any card to open its full signal history.

What's inside each signal?

A clear direction (Buy or Sell), an entry price, a protective stop loss, and take-profit targets, plus a live status that updates as the trade plays out.

How should I size each trade?

We suggest risking 1–2% of your account per trade. Your position size then follows from the stop distance on each signal and the risk percentage you're comfortable with.

Where can I see past results?

Right on this page: the Recent Results chart and the full statistics panel above show every tracked outcome. We publish the complete record, wins and losses alike.

How will I receive signals?

Through whichever channels suit you: the web dashboard, Telegram, our browser extension, and the mobile app all stay in sync, so each signal reaches you wherever you are.

How do I get VIP access?

VIP access comes with every plan; message our team and we'll set you up.

Do you guarantee profits?

No, and be wary of anyone who does. Global Indices trading carries substantial risk. Read our Risk Warning and judge the historical edge for yourself before subscribing.

Can I cancel any time?

Yes. Cancel in one click from your dashboard, no hidden fees and no auto-renewal traps.

Still have questions?

Our team is happy to help before you join; get in touch and we'll walk you through anything you're unsure about.

Trend-led index entries

FTSE 100 Trading Signals and the Pound

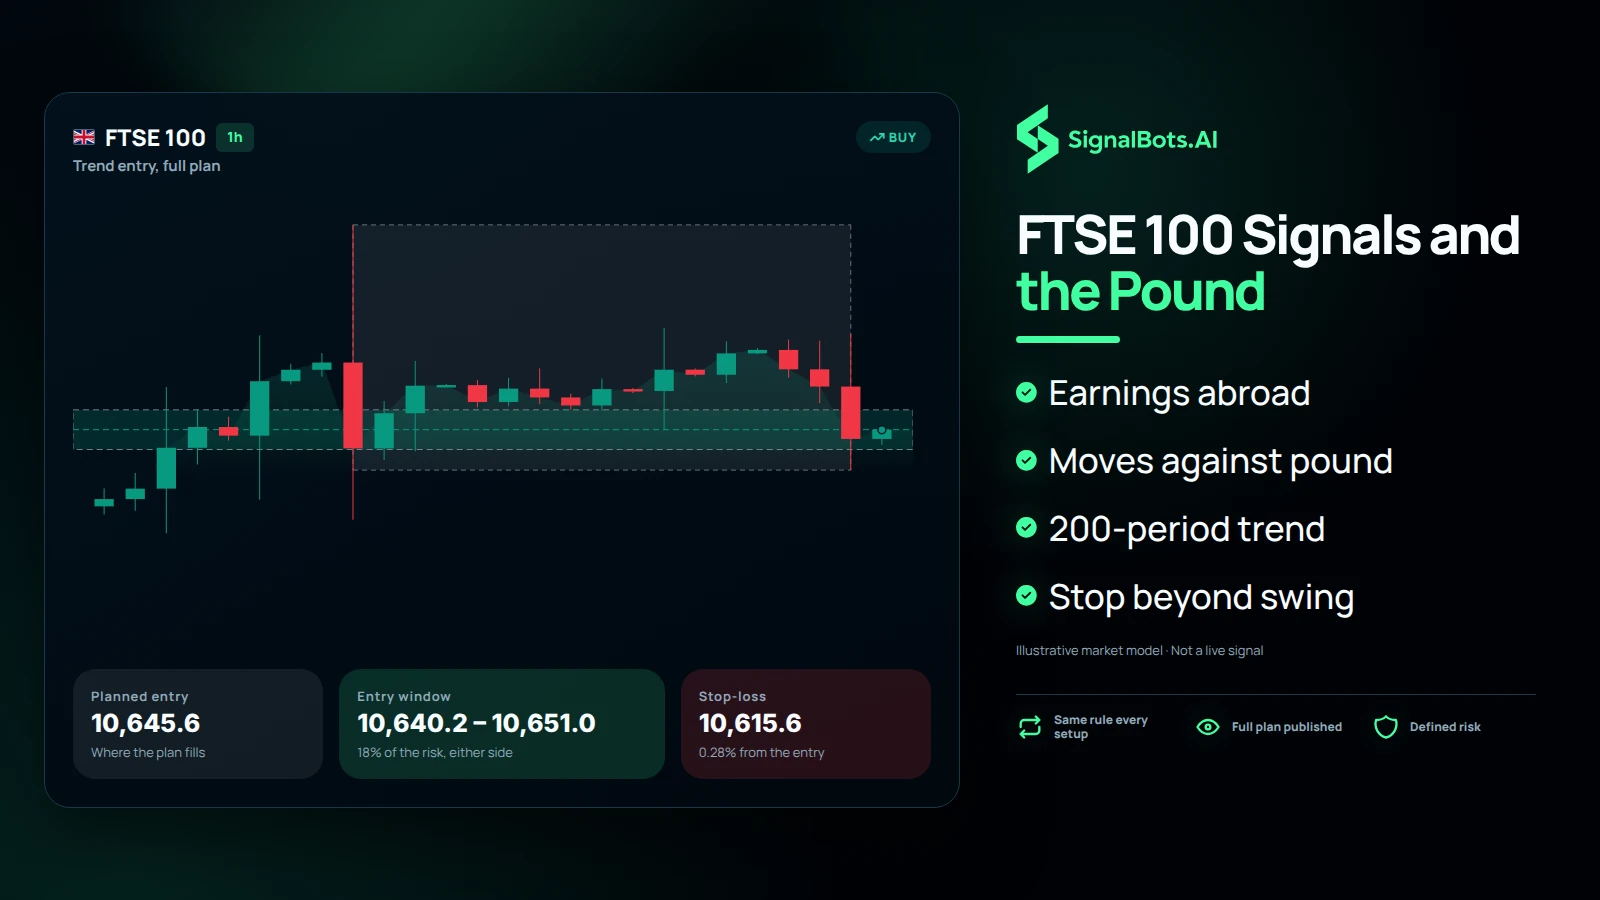
Most of the FTSE 100's earnings come from outside the UK, so the index often rises when the pound weakens and falls when it strengthens. It is also heavy in energy, mining and banking shares, which ties it to oil and metal prices more closely than most indices. Each FTSE 100 signal reads the trend from price against its 200-period average and publishes a full plan with a stop beyond the latest ten-candle swing.

Dark product view headlined "FTSE 100 Signals and the Pound": a 1h FTSE 100 buy chart with its entry window, planned entry, window range and stop-loss cards, beside bullets for earnings abroad, moving against the pound, the 200-period trend and a stop beyond the swing.
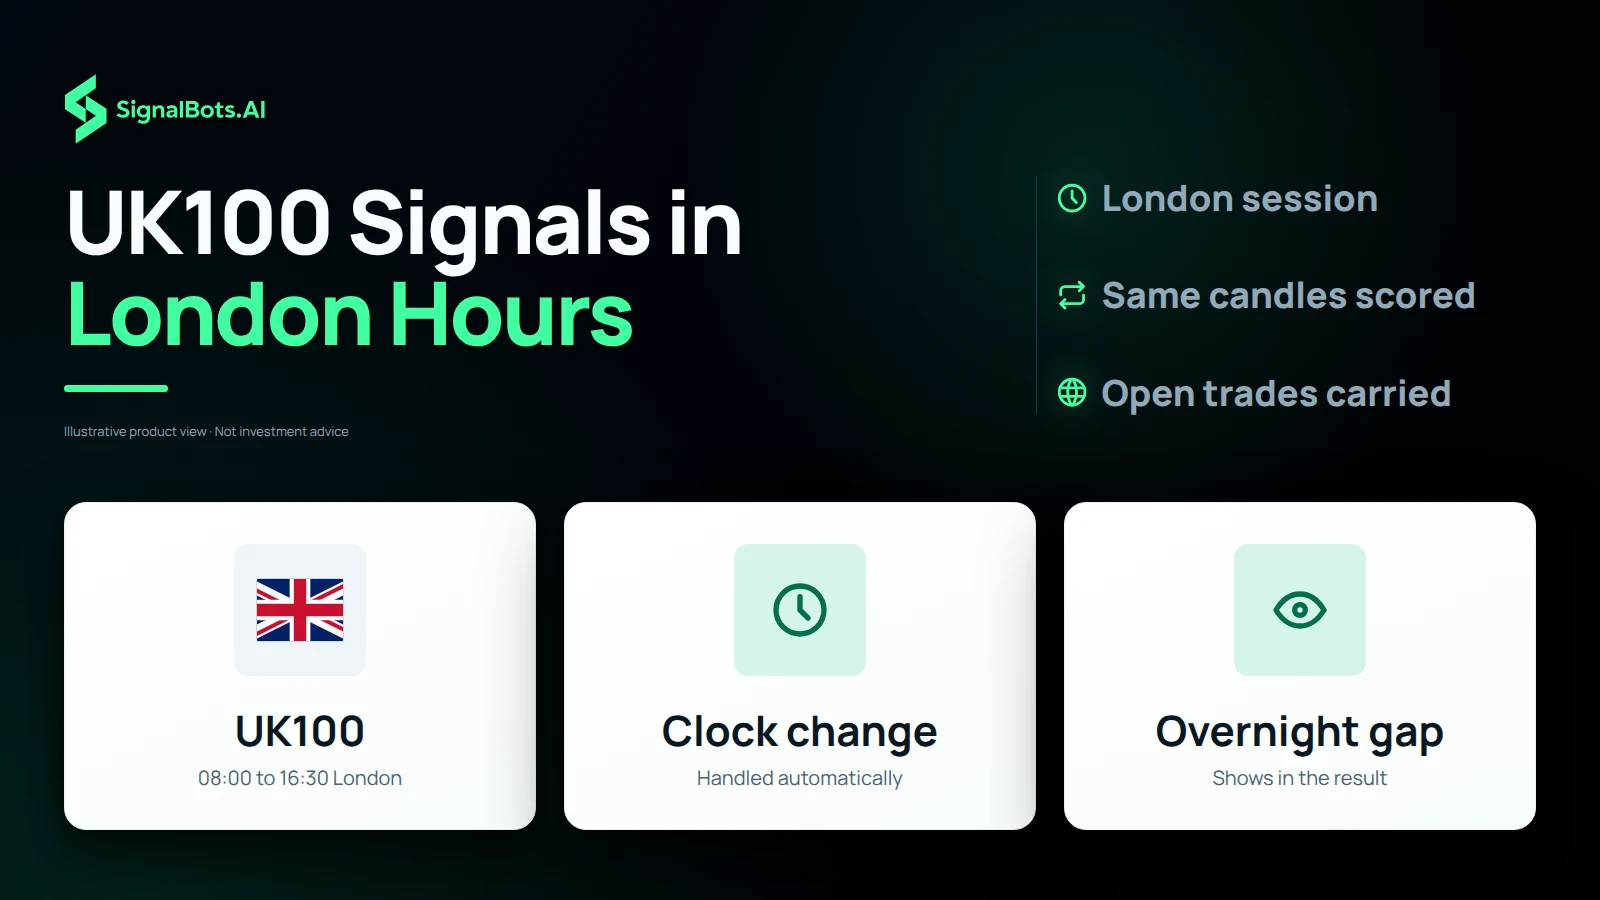
Duotone concept view headlined "UK100 Signals in London Hours" with three tiles: the UK flag for UK100 trading 08:00 to 16:30 London, a clock for the clock change handled automatically, and an overnight gap that shows in the result.

London session timing

UK100 Signals in London Trading Hours

New FTSE 100 signals are issued between 8:00 and 16:30 London time, the London Stock Exchange's trading day, with the clock change handled automatically. Brokers quote the index for longer, but its constituent shares only trade in that window. A trade still open at the London close is picked up again at the next open and scored on the same candles, so any overnight gap shows in its result.

Minimum stop distance

FTSE 100 Signals with a Minimum Stop of About 20 Points

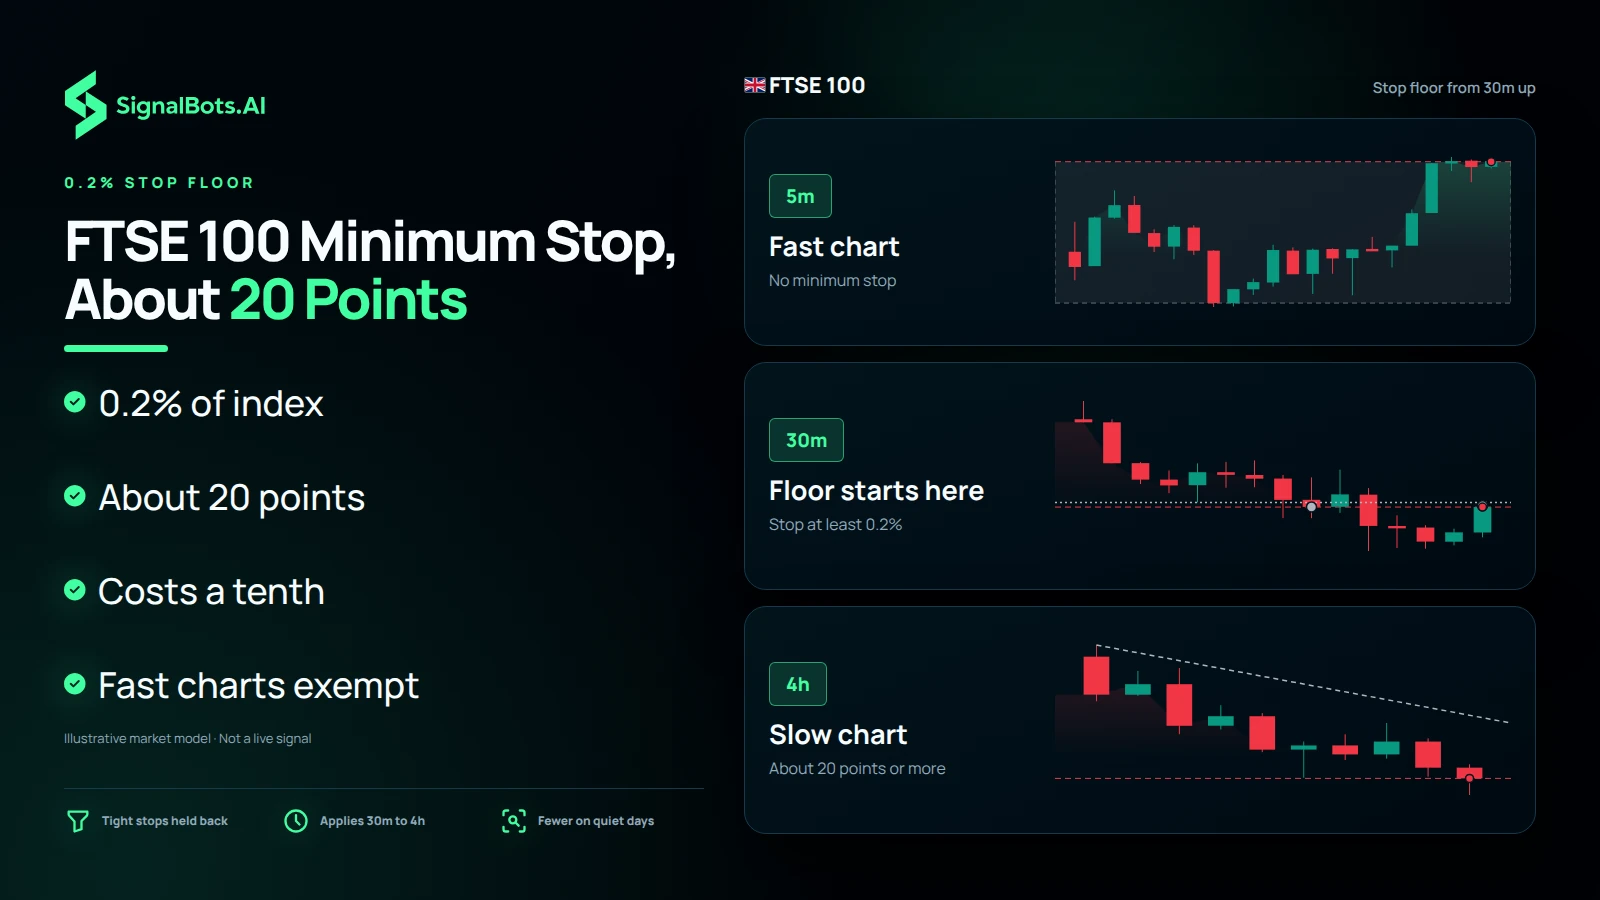
On the 30m, 1h and 4h charts, a FTSE 100 setup is held back unless its stop sits at least 0.2% of the index away, about 20 points at current levels. That keeps trading costs to roughly a tenth of the risk. The FTSE tends to move less than the DAX, so on quiet days fewer setups clear that minimum, while the 1m and 5m charts keep producing setups without it.

Dark market view headlined "FTSE 100 Minimum Stop, About 20 Points": three FTSE 100 chart rungs, 5m with no minimum stop, 30m where the 0.2% floor starts, and 4h at about 20 points or more, beside bullets on the floor, costs and exempt fast charts.
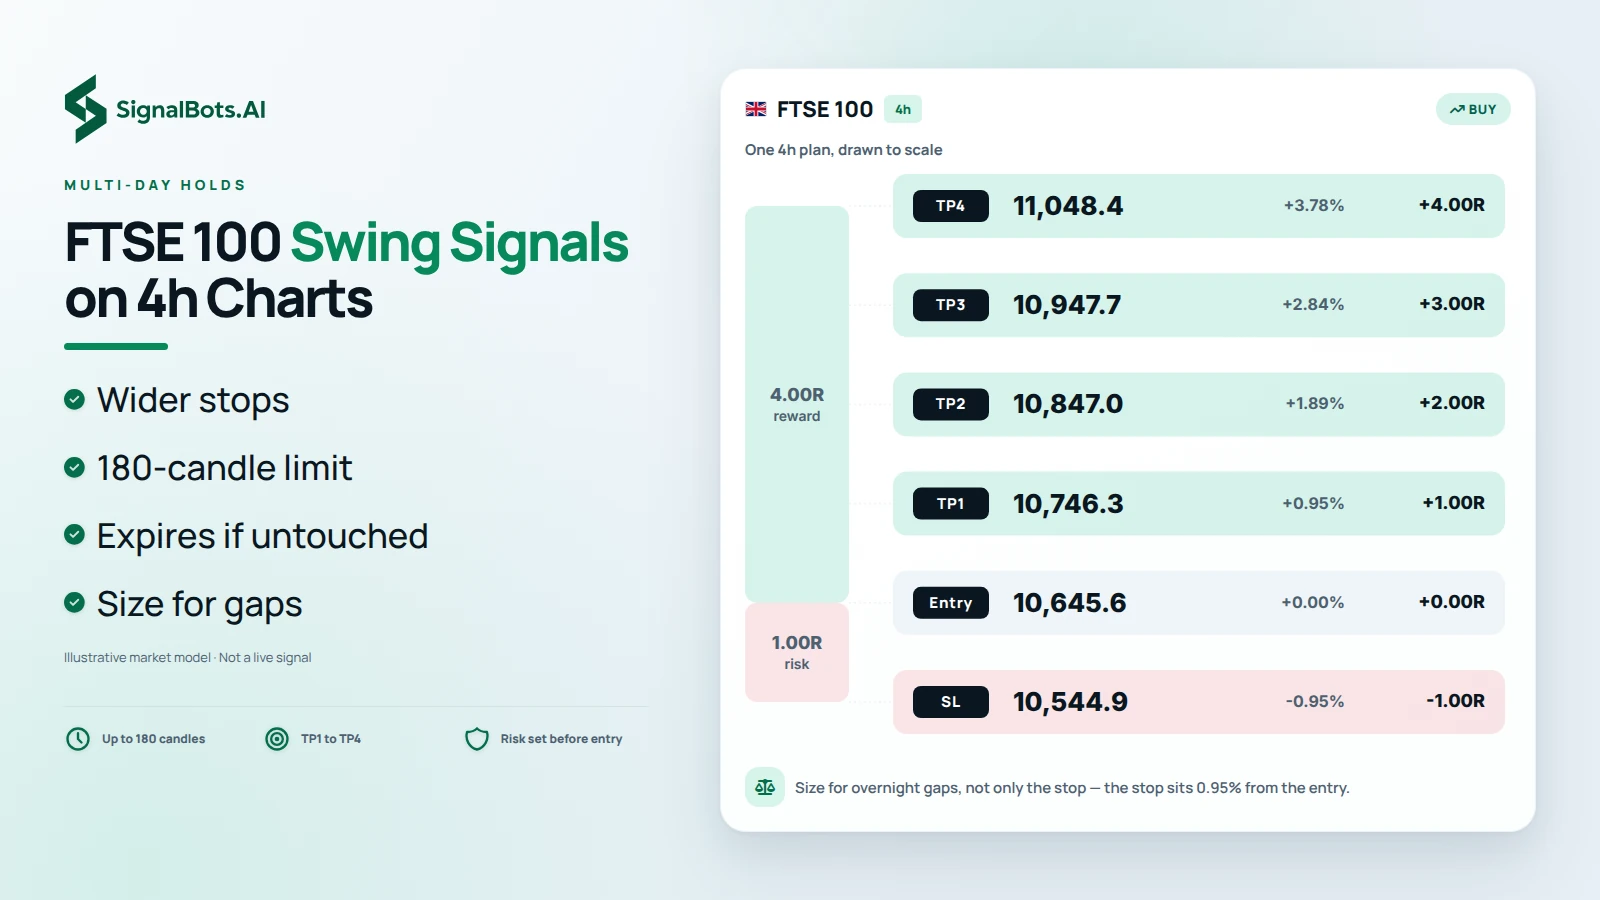
Light market view headlined "FTSE 100 Swing Signals on 4h Charts": one 4h FTSE 100 buy plan drawn to scale with stop-loss, entry and take-profits TP1 to TP4 at 1R to 4R, a note to size for overnight gaps, and bullets on wider stops and the 180-candle limit.

Multi-day holds

FTSE 100 Swing Signals on the 4h Chart

For traders who hold positions over several days, 4h FTSE 100 setups offer wider stops and targets that allow for the index's slower rhythm. Each is followed for up to 180 candles and closed as expired if it reaches neither a target nor its stop. Because the index can gap between London sessions, size these trades for moves that happen while the market is closed, not only for the stop on the chart.

Telegram delivery

FTSE 100 Signals on Telegram

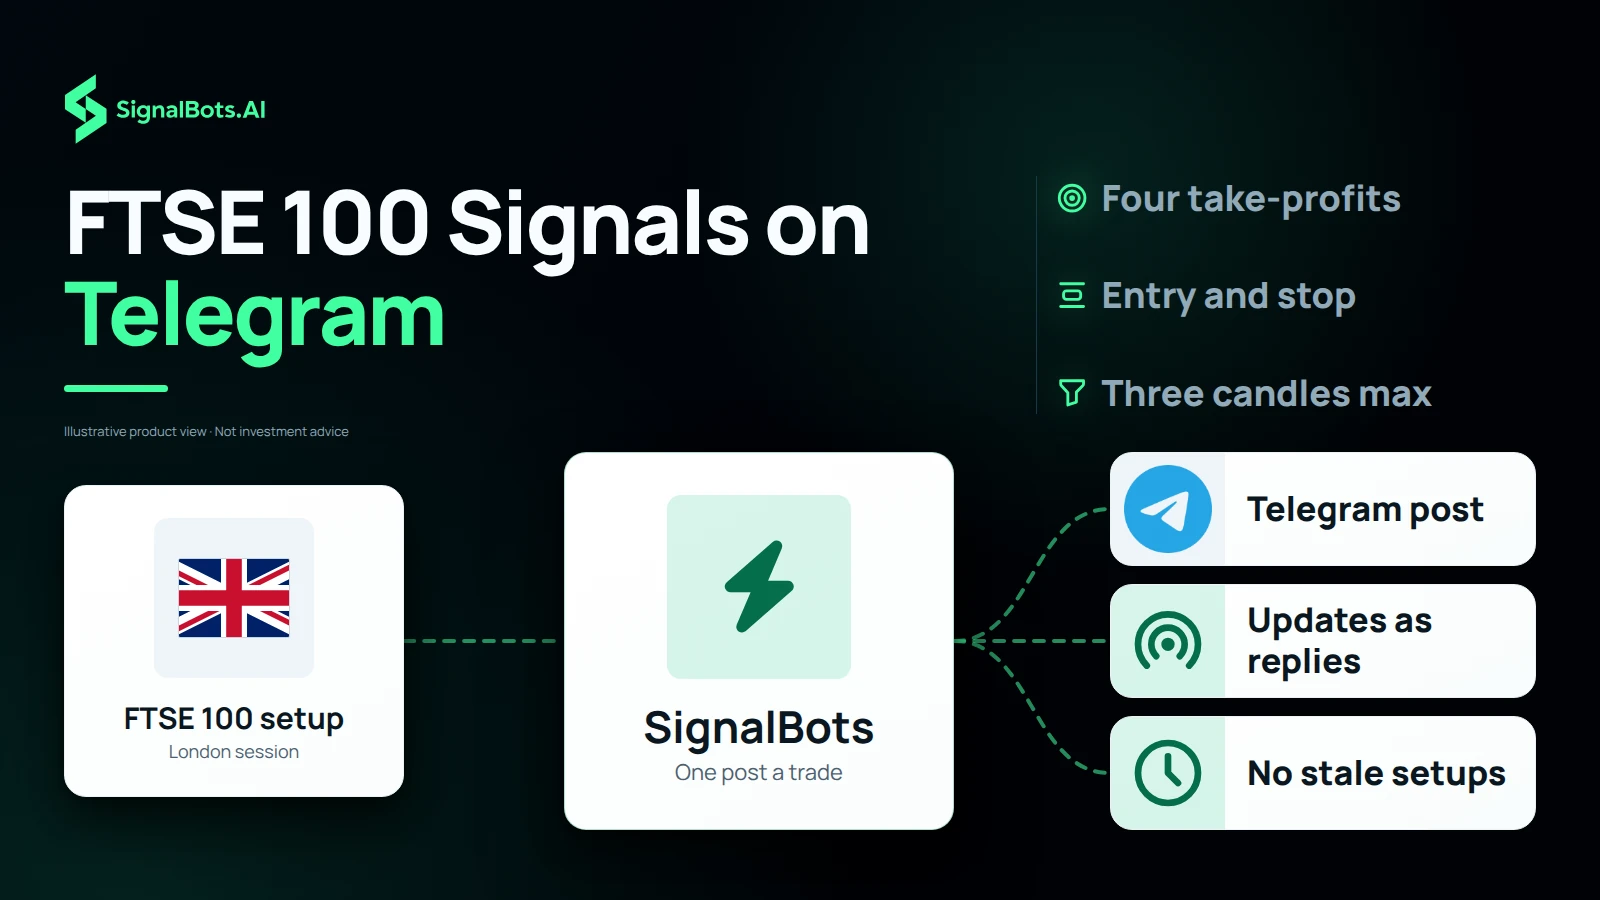
FTSE 100 setups are posted to Telegram during the London session, one message per trade with its entry, stop and four targets. Later updates arrive as replies under that message as the index reaches each level, so a trade taken near the London open can be checked at lunchtime in one glance. Anything already older than three candles when it could be sent is skipped.

Duotone flow diagram headlined "FTSE 100 Signals on Telegram": a FTSE 100 setup from the London session feeds the SignalBots hub, one post a trade, which routes to a Telegram post, updates as replies and no stale setups, with trust notes on four take-profits and a three-candle limit.

Win Rate

Wins vs losses
75%
Win Rate

Gain Chart

Cumulative growth over the last 120 days
Past performance is not indicative of future results. Global Indices trading carries substantial risk. Review our Risk Warning before subscribing.
ROI Calculator

What if you traded with us?

Move the slider: see the cumulative return our tracked signals produced over the last 7 days, applied to your starting capital.

Starting $1,000
After last 7 days $1,760 +$760
Hypothetical, based on historical Win Rate. Not a guarantee of future returns.
+437.73%
Total Gain
4.11%
Max Drawdown
+$41975.5
Net Profit
Full Advanced Statistics Click to expand

Advanced Statistics

Updated Oct 29, 2026 · 11:10 GMT
Balance $51975.5
Equity (100.00%) $51975.5
Floating PL $0.0
Deposits $10000.0
Withdrawals $0
Trades 404
Pips 41975500
Won 97%
Avg. Trade Time
Lots 52.52
Profit Factor 24.36
Daily 1.04%
Monthly 31.32%
Trades Per Month 30
Expectancy 1410205.3 Pips / $1410.21
Built for your broker

Keep your broker. Keep your edge.

No switching accounts, no relearning a platform. Whichever forex broker you already trade with, these signals plug straight in. Read them here, or let our extensions, robots and connectors act on them for you.

Trusted by traders

What FTSE 100 (UK) Traders Are Saying

A FTSE 100 (UK) trade plan I can check before acting

On the Global Indices signals page, the FTSE 100 (UK) entry, stop and targets give me a defined checklist instead of a rushed decision.

Yiannis Dimitriou
Yiannis Dimitriou Greece

FTSE 100 (UK) history makes the process easier to review

I use the Global Indices Recent Results and FTSE 100 (UK) monthly table to study the setup before I decide whether it fits my own risk plan.

Ananya Menon
Ananya Menon India

FTSE 100 (UK) levels help me avoid chasing

Seeing the Global Indices FTSE 100 (UK) stop alongside the target keeps me patient when price is already moving quickly.

Daan de Vries
Daan de Vries Netherlands

FTSE 100 (UK) context without hiding the risk

The Global Indices FTSE 100 (UK) page makes the outcome history visible, so I can keep position size and risk limits under my own control.

Aino Makinen
Aino Makinen Finland

One focused view for FTSE 100 (UK)

The Global Indices FTSE 100 (UK) alerts and symbol filters make it much easier to follow the instruments I actually trade.

Jakub Prochazka
Jakub Prochazka Czechia

Ready to trade FTSE 100 (UK) with us?

Full access to every signal, with instant alerts on the web, Telegram, our extension and mobile app.

No card needed
VIP Access $49/mo · 7-day free trial